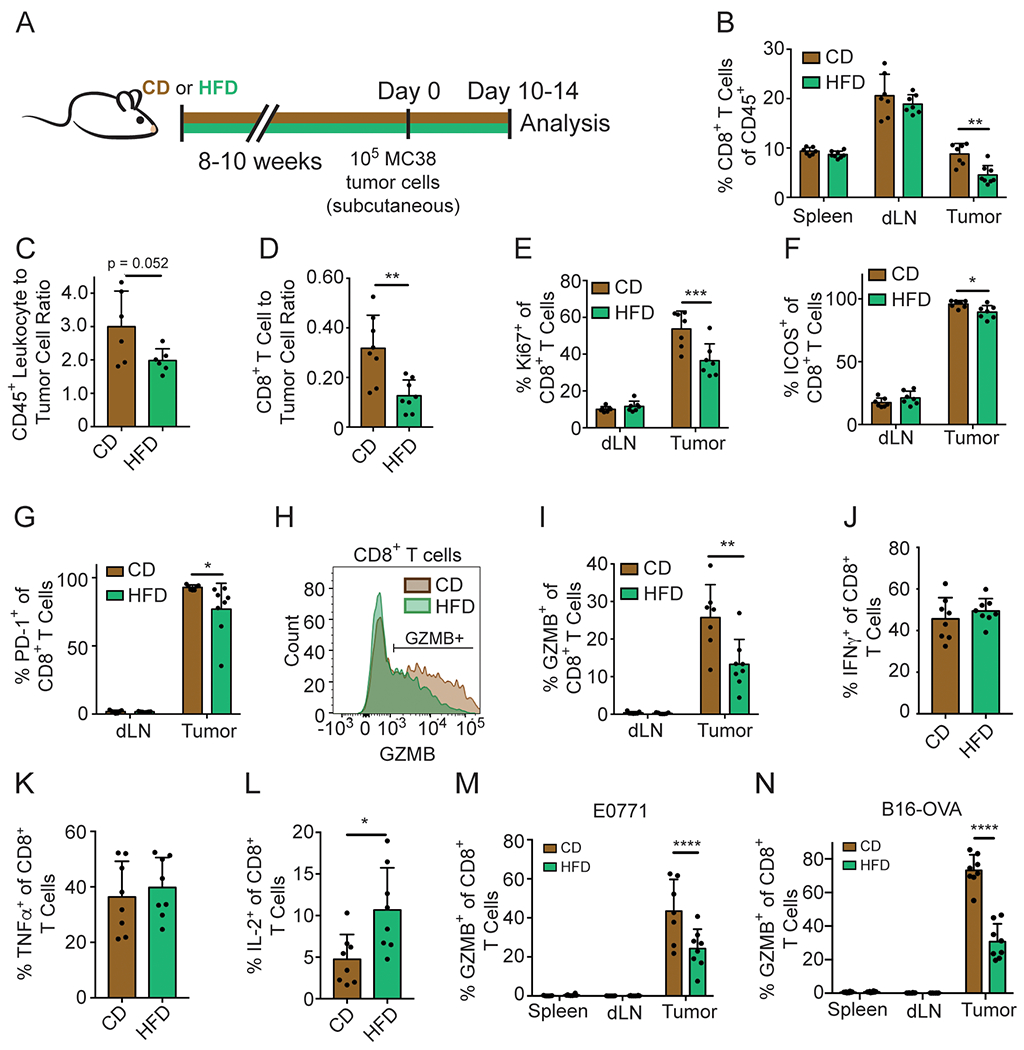
Figure 2. HFD reduces intratumoral CD8+ T cell numbers and functionality.

(A) Schematic depicting experimental setup.
(B-L) Flow cytometry analysis of MC38 (B, E-L), MC38-GFP (C-D), E0771 (M) or B16-OVA-RFP (N) tumors on day 10-14 after inoculation.
(B) Quantification of the percentage of CD8+ T cells among intratumoral CD45+ cells.
(C-D) The ratio of CD45+ cells (C) or CD8+ T cells (D) to MC38-GFP tumor cells.
(E-G) Quantification of Ki67 (E), ICOS (F), and PD-1 (G) expression among CD8+ TILs.
(H-I) Representative flow plot (H) and quantification (I) of GZMB expression among CD8+ TILs.
(J-L) Quantification of IFNγ (J), TNFα (K) and IL-2 (L) expression among CD8+ TILs after ex vivo phorbol myristate acetate (PMA)/ionomycin stimulation.
(M-N) Quantification of GZMB expression among CD8+ TILs in E0771 (M) and B16-OVA-RFP (N) tumors.
Data represent ≥ two independent experiments with ≥ 6 mice per group. (ns p>0.05, *p≤0.05, **p≤0.01). Graphs display mean +/− SD (B-G, I-N).
See also Figure S2.
