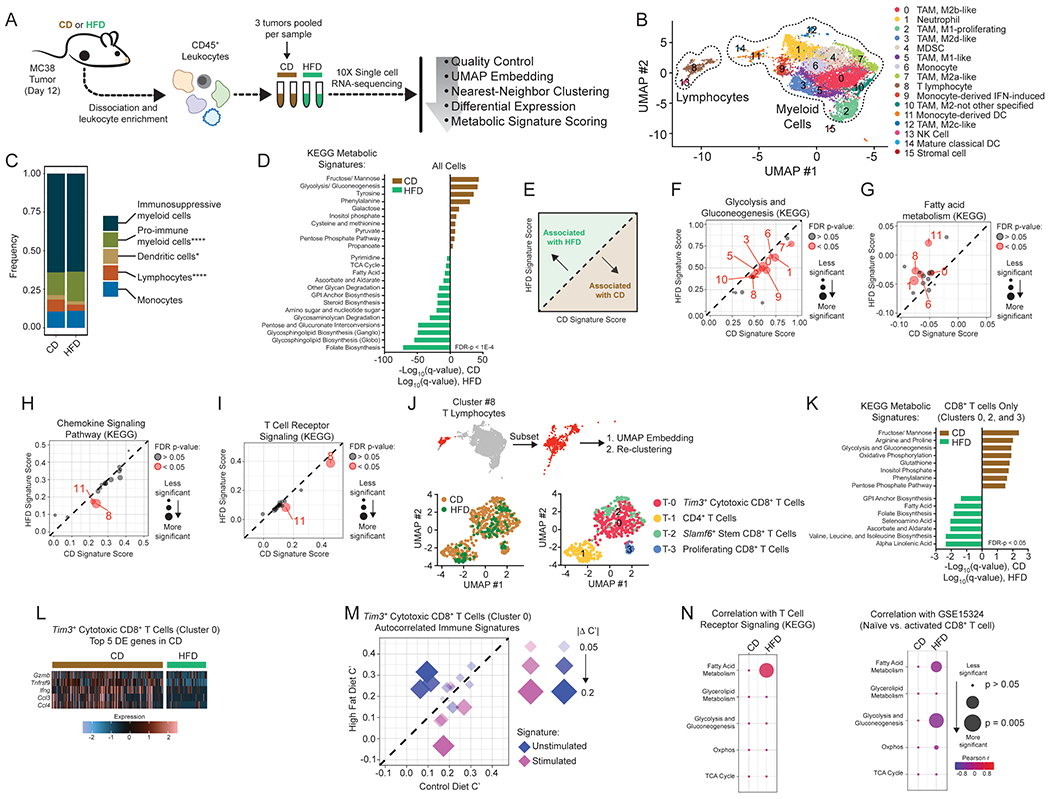
Figure 3. Single-cell analysis reveals global metabolic remodeling of tumor-immune infiltrate.

(A) Schematic depicting single-cell RNA-seq experiment and analysis.
(B) Identification of tumor-infiltrating immune cell populations. Uniform Manifold Approximation and Projection (UMAP) embeddings of single-cell RNA-seq profiles from 9,104 CD45+ leukocyte cells showing 16 clusters identified by integrated analysis, colored by cluster. Representative of one experiment, n = 6 pooled CD mice and n = 3 pooled HFD mice.
(C) Barplot depicting proportional differences in leukocyte infiltrate from HFD versus CD tumors. Each class contains the following clusters from 3B: immunosuppressive (all M2 macrophage clusters #0, #3, #7, #10, #12; neutrophils #1, and MDSCs #4), pro-immune (all M1 macrophage clusters #2 and #5), dendritic cells (clusters #11 and #14), monocytes (clusters #6 and #9), and lymphocytes (T lymphocytes #8 and natural killer cells #13).
(D) Enrichment of KEGG metabolic signature scores in all single-cell transcriptomes for HFD versus CD tumors.
(E) Schematic depicting the interpretation of panels F-I.
(F-I) Scatterplots showing average signature score, calculated in VISION, for curated KEGG pathways on a cluster-by-cluster basis in HFD versus CD for glycolysis and gluconeogenesis (F), fatty acid metabolism (G), chemokine signaling pathway (H), and T cell receptor signaling (I).
(J) Subset and re-clustering of T lymphocytes from cluster #8 (top), colored by diet (lower left) or cluster (lower right).
(K) Enrichment of KEGG metabolic signature scores that are altered by diet in single-cell transcriptomes from re-clustered CD8+ T cells. CD and HFD q-values are depicted in positive and negative directions, respectively.
(L) Heatmap of the top 5 differentially expressed genes enriched in Tim3+ cytotoxic CD8+ tumor-infiltrating lymphocytes from CD animals (cluster #T-0).
(M) Scatterplot comparing autocorrelation scores computed in Vision for curated immune gene signatures in Tim3+ cytotoxic CD8+ tumor-infiltrating lymphocytes (cluster #T-0). Plot depicts immune signatures that are significantly autocorrelated in at least one diet condition, and the point size reflects the magnitude of the difference in autocorrelation between HFD and CD.
(N) Correlation between KEGG metabolic pathway signatures involved in major carbon-handling pathways and KEGG T Cell Receptor Signaling (left) or Naïve vs. activated CD8+ T cell (GSE15324) signature (right) in Tim3+ cytotoxic CD8+ T cells (cluster #T-0).
Statistical significance was assessed by two-sided binomial test (C), Wilcoxon rank sum with FDR correction using the method of Benjamini and Hochberg (D, F-I, K), empirical p-value calculation with FDR-correction within Vision (M), and by asymptotic t approximation (N). (ns p>0.05, *p≤0.05, **p≤0.01, ***p≤0.001, ****p≤0.0001).
See also Figure S3.
