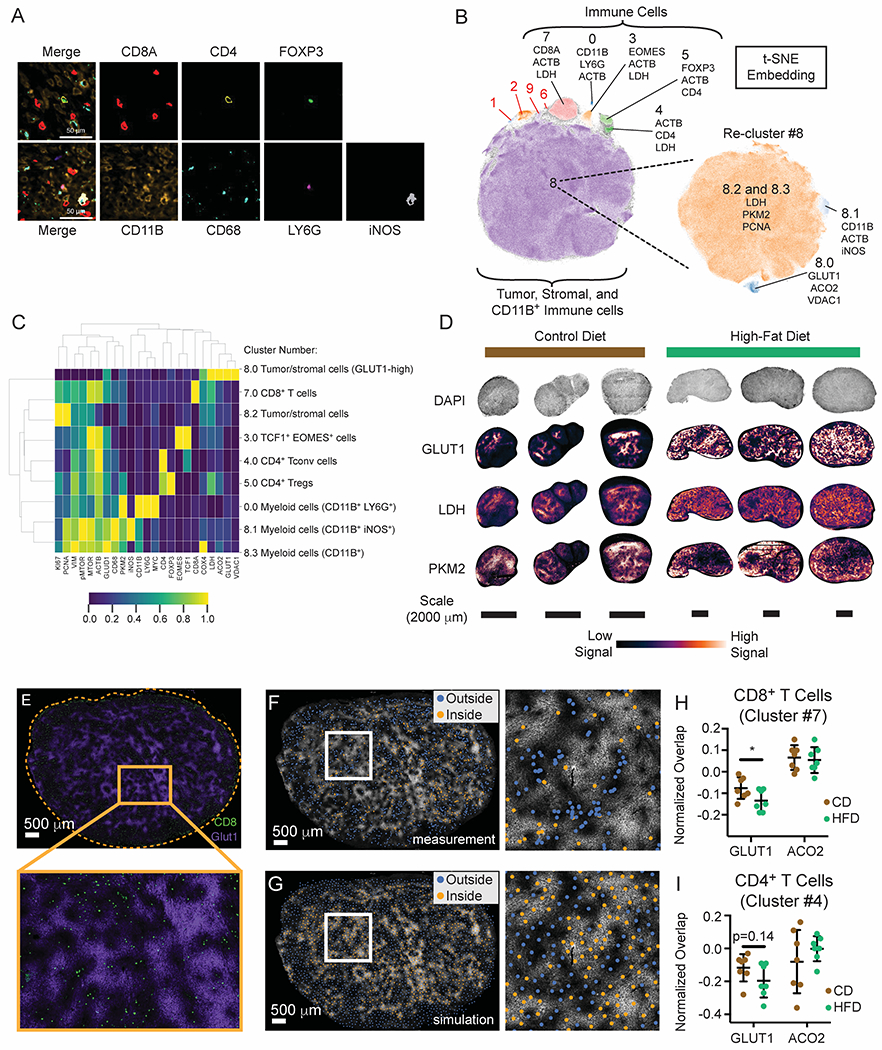
Figure 4. Multiplexed imaging reveals metabolic remodeling in tumors with HFD.

(A-E) CyCIF analysis of MC38 HFD versus CD tumors.
(A) Representative image of CD tumors depicting segregation of immune lineage markers. Scale bars are 50 μm.
(B) Cell populations identified by t-SNE embedding and density-based clustering, showing the top three markers expressed per population.
(C) Heatmap depicting cell populations identified by HDBSCAN from Figure 4B.
(D) Expression pattern of glycolytic genes in CD and HFD tumors.
(E) Representative t-CyCIF image showing GLUT1 (purple) and CD8α (green) expression in the MC38 TME (HFD tumor shown). Scale bar is 500 μm.
(F-G) Representative images depicting real and simulated data used for spatial analysis. GLUT1 expression in the HFD TME superimposed with scatter points representing the x, y coordinates of cells classified as CD8+ T cells (F) or a similar number of uniformly-distributed data points across the same tissue area as generated by Poisson-Disc sampling (G). Data points are colored according to their inclusion (orange) or exclusion (blue) from areas of high GLUT1 expression. Scale bars are 500 μm.
(H-I) Normalized fraction of CD8+ (H) and CD4+ (I) T cells overlapping areas of high GLUT1 or ACO2 expression in the MC38 tumor microenvironment.
Statistical significance was assessed by student’s t-test (H-I). (ns p>0.05, *p≤0.05, **p≤0.01, ***p≤0.001).
See also Figure S4.
