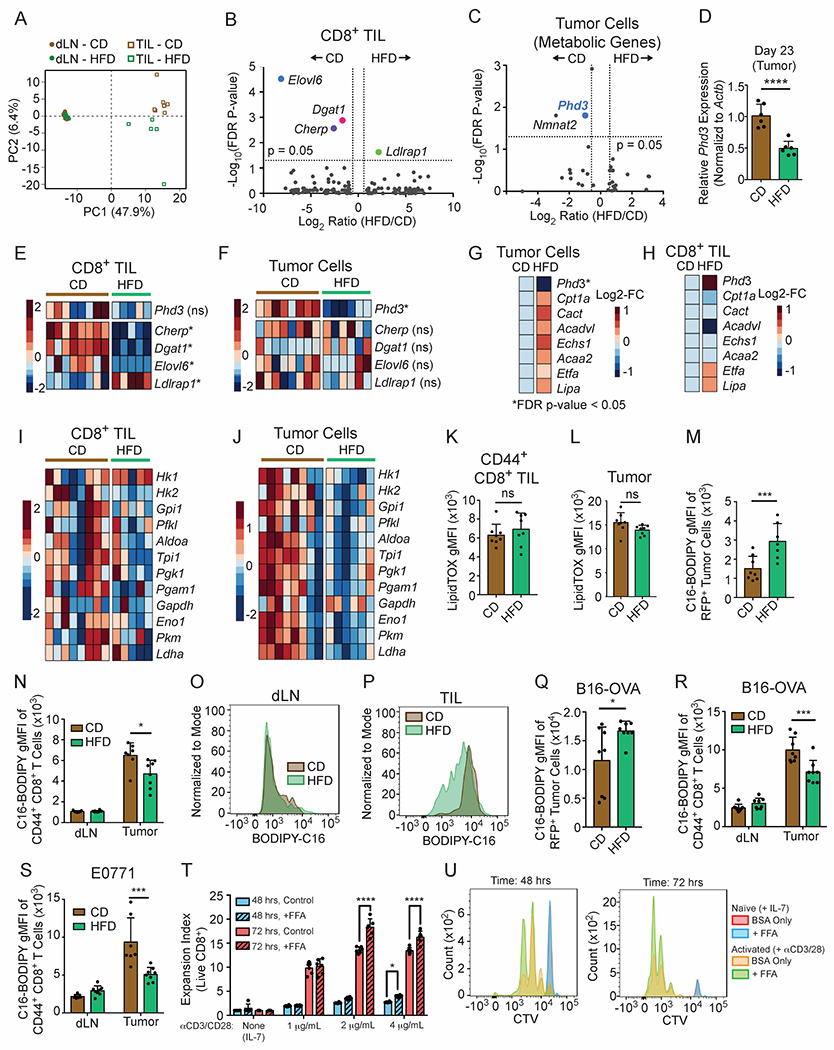
Figure 5. HFD induces distinct metabolic adaptations in MC38 tumor cells and CD8+ TILs.

(A-C, E-J) Analysis of RNA-sequencing data performed on cells sorted from day 12 MC38 tumors from CD-fed and HFD-fed animals.
(A) Principal component analysis of the top 400 genes with the largest variance from CD8+ TILs versus CD8+ T cells from the dLN in animals fed HFD or CD.
(B) Volcano plot comparing gene expression levels in CD8+ TILs from CD and HFD tumors. Genes with FDR-corrected p-value < 0.05 are highlighted. Dotted lines indicate 1.5-fold change.
(C) Volcano plot depicting differentially expressed metabolic genes in MC38-GFP tumor cells. Metabolic genes were defined as the union of the following GO gene subsets: GO:0006520 Cellular Amino Acid Metabolic Process, GO:0005975 Carbohydrate Metabolic Process, and GO0006629 Lipid Metabolic Process, or GO:0006099 Tricarboxylic acid cycle, excluding transcription factors. Dotted lines indicate 1.5-fold change.
(D) Phd3 expression in day 23 MC38 tumors measured by qPCR.
(E-F) Heatmaps showing relative expression in CD8+ TILs (E) and MC38 tumor cells (F) of genes that are significantly differently expressed between CD and HFD tumor cells (Phd3) or CD8+ TILs (Cherp, Dgat1, Elovl6, Ldlrap1).
(G-H) Average expression for genes involved in FAO from tumor cells (G) and CD8+ TILs (H).
(I-J) Heatmaps depicting glycolytic genes in CD8+ TILs (I) versus tumor cells (J).
(K-L) Ex vivo LipidTox neutral lipid staining in CD8+ TILs (K) and GFP+ MC38 cells (L) in day 10-14 tumors.
(M) Quantification of C16-BODIPY uptake ex vivo in MC38-RFP tumor cells.
(N-P) Quantification of C16-BODIPY uptake in ex vivo CD8+ T cells (N). Representative histograms for ex vivo C16-BODIPY uptake in CD8+ T cells isolated from dLN (O) or tumor (P) from day 10-14 MC38 tumors.
(Q-S) Quantification of C16-BODIPY uptake ex vivo from dissociated tumors: B16-OVA-RFP tumor cells (Q) or CD8+ TILs isolated from B16-OVA-RFP (R) and E0771 tumors (S) or dLN.
(T-U) Expansion index (T) and representative flow plots (U) measuring proliferation of CTV-labeled CD- and HFD-derived naïve CD8+ T cells after 48 and 72 hours on 1, 2, or 4 μg/mL each of plate-bound anti-CD3 and anti-CD28, with or without supplementation of BSA-conjugated free fatty acids (FFAs).
Data represent ≥ two independent experiments with ≥ 6 mice per group. Graphs display mean +/− SD (K-N, Q-T). (ns p>0.05, *p≤0.05, **≤<0.01).
See also Figure S5.
