
Figure 6. Protein-level analysis confirms enhanced fatty acid uptake and oxidation by HFD tumor cells.
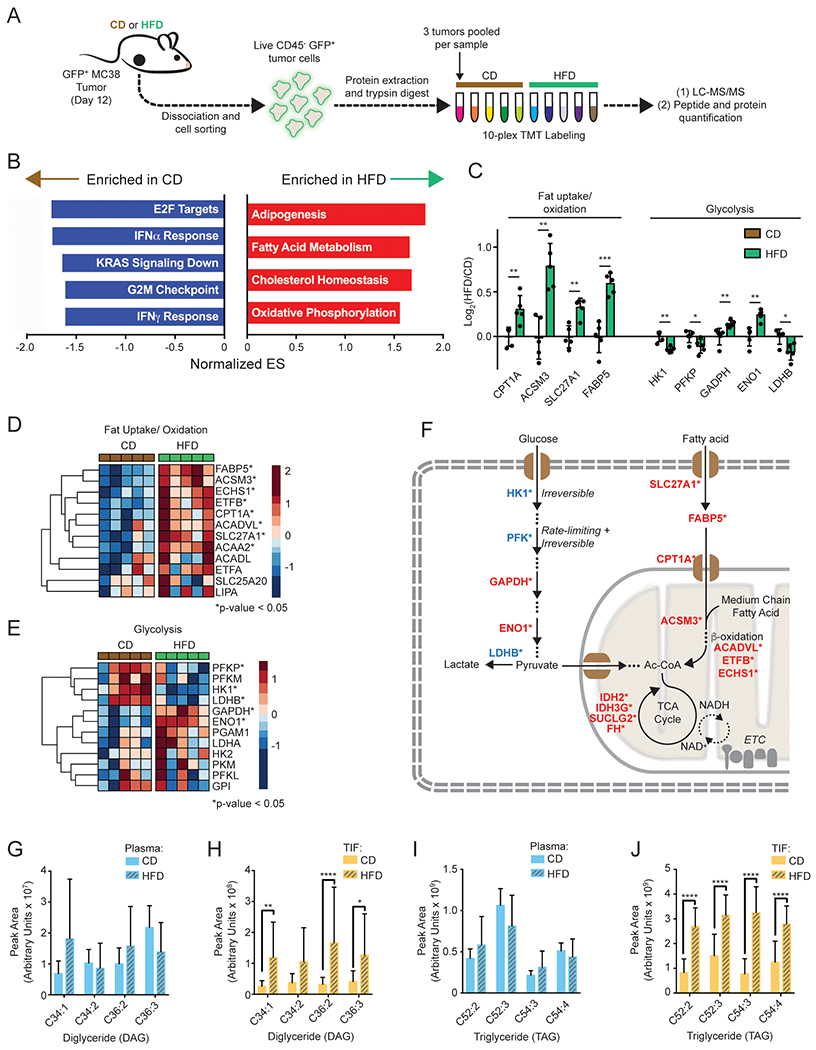
(A) Schematic depicting TMT-proteomics experiment.
(B) Enrichment analysis using Hallmark gene sets from MSigDB.
(C) Bar graph showing relative expression of key proteins involved in fat oxidation or glycolysis.
(D-E) Heatmaps depicting relative expression levels of proteins involved in fat uptake and oxidation (D) or glycolysis (E).
(F) Schematic depicting key upregulated (red) or downregulated (blue) proteins in fat uptake and oxidation, glycolysis, and TCA cycle.
(G-J) Relative abundance of indicated DAG (G-H) and TAG (I-J) lipid species in CD and HFD plasma (G,I) and TIF (H,J).
Key abbreviations: DAG, diglyceride. ES, Enrichment Score, TAG, triglyceride. TIF, tumor interstitial fluid. Graphs display mean +/− SD. Statistical significance was assessed by Student’s t-test (C-J). (ns p>0.05, *p≤0.05, **p≤0.01, ***p≤0.001, ****p≤0.0001).
See also Figure S6.