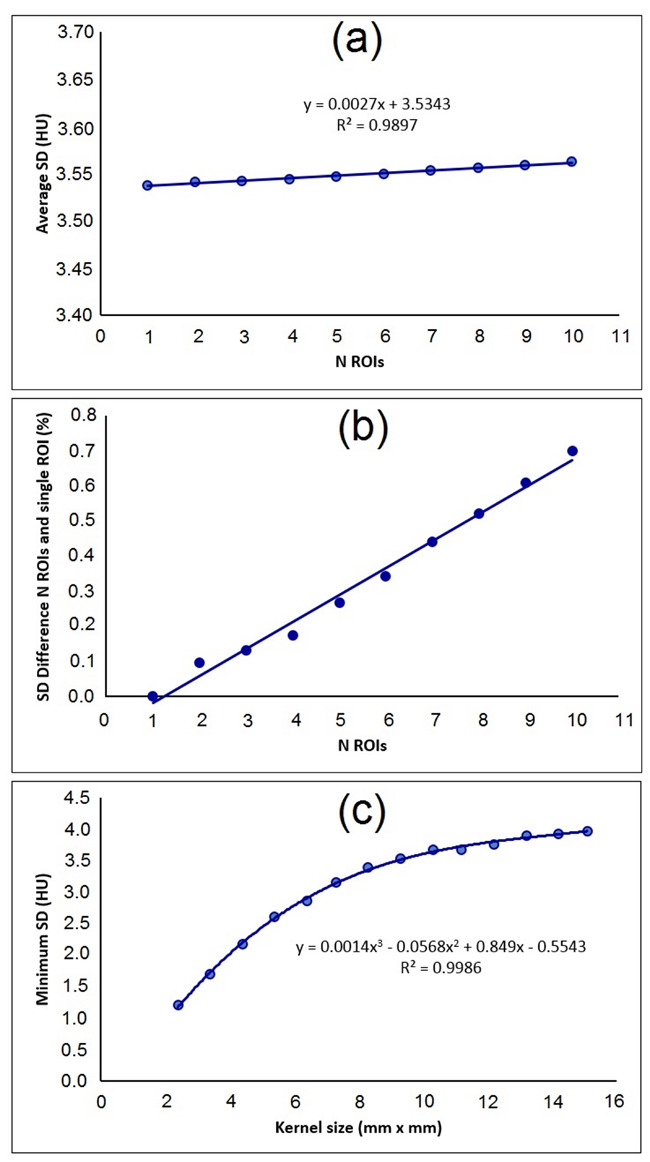
Figure 4.

(a) The noise of average N smallest standard deviations (SDs), (b) The percentage difference of noise in the use of one of region of interest (ROI) and N ROIs, and (c) The noise magnitude of a homogeneous phantom as a function of the ROI size (or kernel size).
