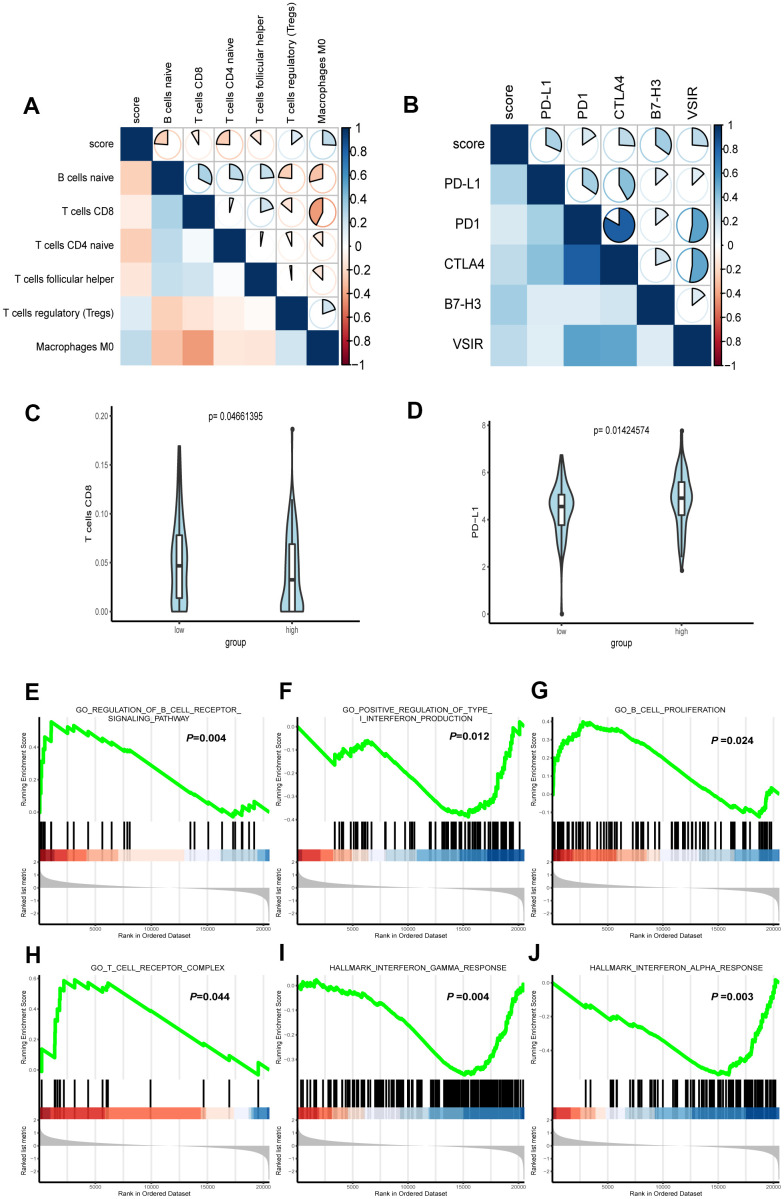
Figure 6.
Correlation between immune characteristics with the FRG signature. (A) Spearman correlation analysis was conducted to determine the correlation of immune cells with risk score of the signature. (B) Spearman correlation analysis was conducted to determine the correlation of immune checkpoint inhibitors PD-1, PD-L1, CTLA-4, B7H3, and VSIR with risk score of the signature. (C) CD8+ T cell infiltration in high- and low-risk groups. (D) The expression level of PD-L1 in high- and low-risk groups. (E–J) Representative enriched pathways in immune character associated with FRG signature by GSEA analysis.

