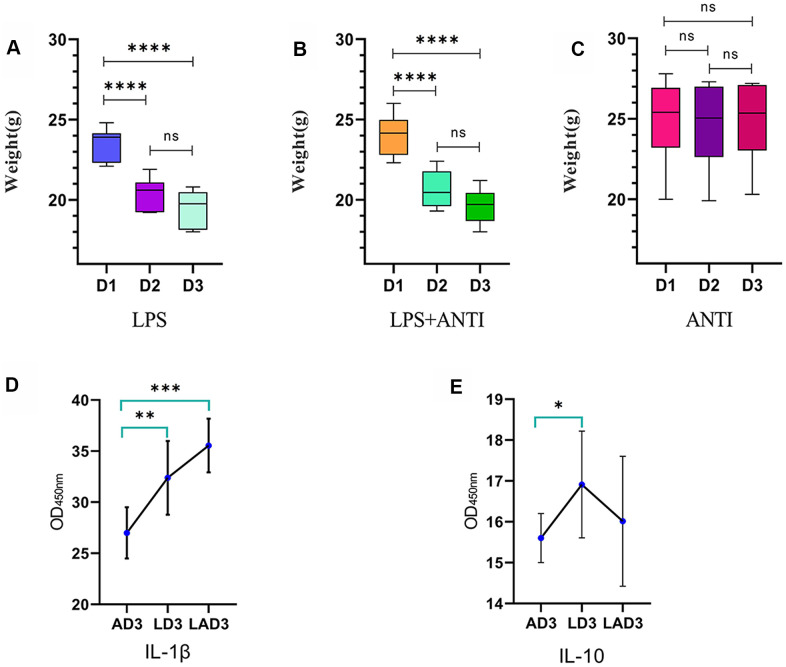
Figure 1.
Weight change trend of LPS group, LPS + antibiotic group and antibiotic group before and after administration. (A) The weight change trend of mice in LPS group from day 1 to day 3 (D1, D2, D3), and the levels of IL-1 β and IL-10 in intestinal tract (AD3, LD3 and LAD3) on the third day after administration were detected by ELISA. (B) The body weight of mice in LPS + antibiotic group changed from day 1 to day 3 (D1, D2, D3). (C) The weight change trend of mice in antibiotic group from day 1 to day 3 (D1, D2, D3). (D) The levels of IL-1 β in AD3, LD3 and LAD3 groups were compared. *P<0.05, **P<0.01, ***P<0.001, ns>0.05. (E) The levels of IL-10 in AD3, LD3 and LAD3 groups were compared.*P<0.05, **P<0.01, ***P<0.001, ns>0.05.

