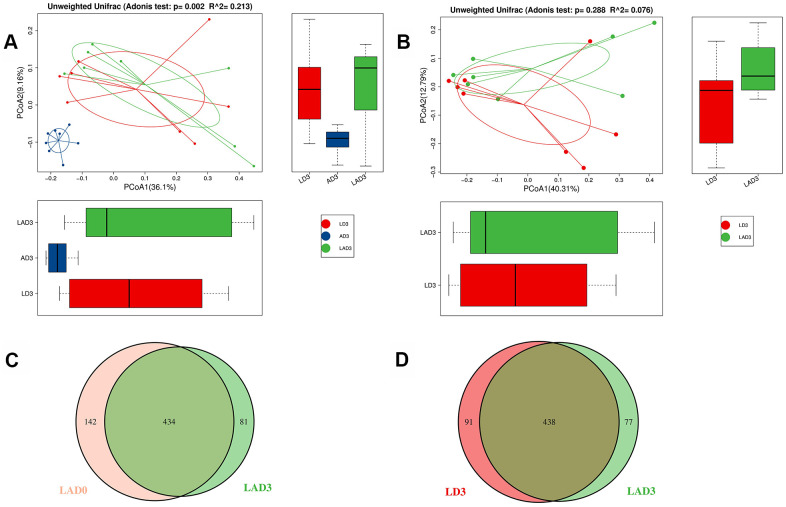
Figure 2.
Adonis analysis was used to compare the difference of beta diversity among LD3, LAD3 and AD3. OTU Venn diagram was used to calculate the number of common and unique OTUs of LAD0 and LAD3 and LD3 and LAD3. (A) Compare LD3, Adonis analysis of species diversity between AD3 and LAD3 groups. (B) Adonis analysis of species diversity between LD3 and LAD3 groups. (C) OTU Venn analysis of fecal abundance between LAD0 and LAD3 groups. (D) OTU Venn analysis of fecal abundance between LD3 and LAD3 groups; P ≤ 0.01 means an extremely significant difference).

