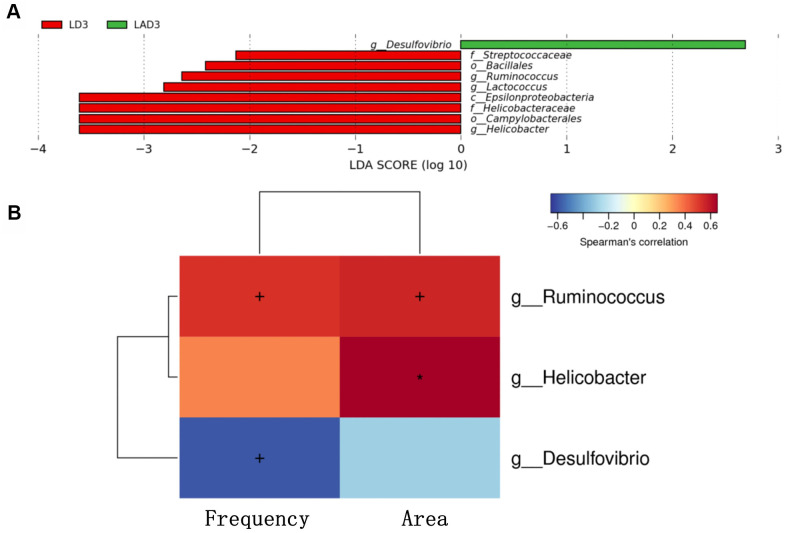
Figure 3.
Linear discriminant analysis effect size (lefse) was used to analyze the species abundance of LD3 and LAD3 groups. Spearman correlation thermography was used to analyze the correlation between different species and intestinal motility indexes (frequency, area) between LD3 and LAD3 groups. (A) Lefse analysis was used to compare the main functional species between LD3 and LAD3 groups. (B) Spearman correlation heat map was used to compare the correlation between LD3 and LAD3 groups and the frequency and area of intestinal motility index. Ruminococcus and Helicobacter were positively correlated with frequency and area, while Desulfovibrio was negatively correlated. (p < 0.05, + marks significance, p < 0.01, “*” marks significance).

