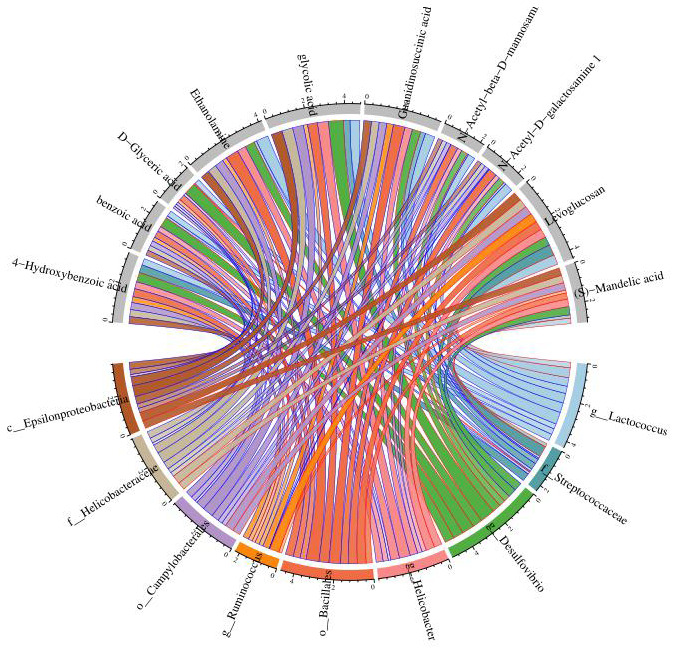
Figure 6.

Chord diagram analysis was used to show the relationship between specific metabolites and intestinal microbiota, and Desulfovibrio was positively correlated with benzoic acid and 4-hydroxybenzoic acid. Nodes represent different species and different metabolites; chord width indicates correlation strength, chord border color indicates correlation, red indicates positive correlation, and blue indicates negative correlation.
