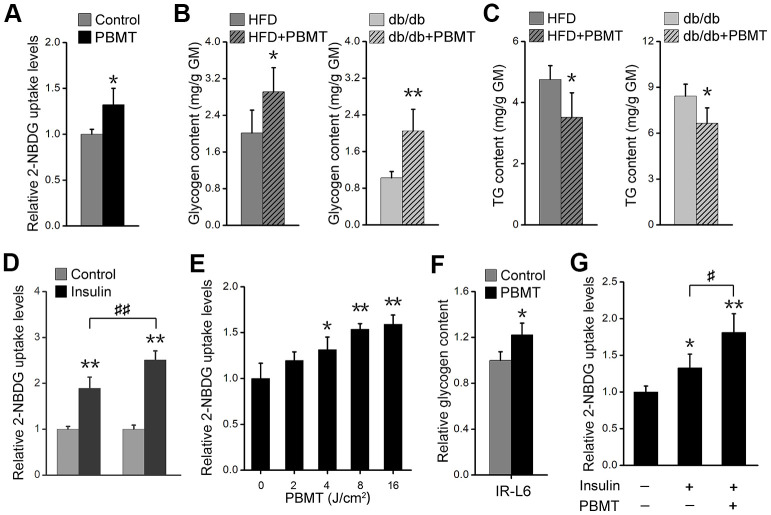
Figure 2.
PBMT ameliorates metabolic disorders of skeletal muscle in mouse models. (A) 2-NBDG uptake of GMs 30 min after PBMT. The fresh muscles were isolated from HFD-fed mice for 6 weeks. Mean ± SD, n = 4. *p < 0.05 vs. the control group (Student’s t-test). (B, C) Glycogen (B) and TG (C) contents in GMs isolated from HFD-fed mice and db/db mice with or without PBMT for 10 weeks. The experiences were performed 12 hours after the last PBMT. Mean ± SD, n = 4. *p < 0.05, **p < 0.01 vs. the PBMT-untreated mice (Student’s t-test). (D) 2-NBDG uptake in insulin-stimulated GM from HFD-fed mice with or without PBMT for 10 weeks. The experiences were performed 12 hours after the last PBMT. Mean ± SD, n = 4. **p < 0.01 vs. the control groups; ##p < 0.01 vs. the indicated group (Student’s t-test). (E) 2-NBDG uptake in IR-L6 myotubes 30 min after different doses of laser irradiation. Mean ± SD, n = 4. *p < 0.05, **p < 0.01 vs. the PBMT-untreated group (Student’s t-test). (F) Glycogen content in IR-L6 myotubes treated with 8 J/cm2 PBMT every 12 h for 1 day. Six hours after the last PBMT, glycogen was measured. Mean ± SD, n = 4. *p < 0.05 vs. the control group (Student’s t-test). (G) 2-NBDG uptake in IR-L6 myotubes 30 min after 10 nM insulin and/or 8 J/cm2 PBMT. Mean ± SD, n = 4. *p < 0.05, **p < 0.01 vs. the control group; #p < 0.05 vs. the indicated group (Student’s t-test).

