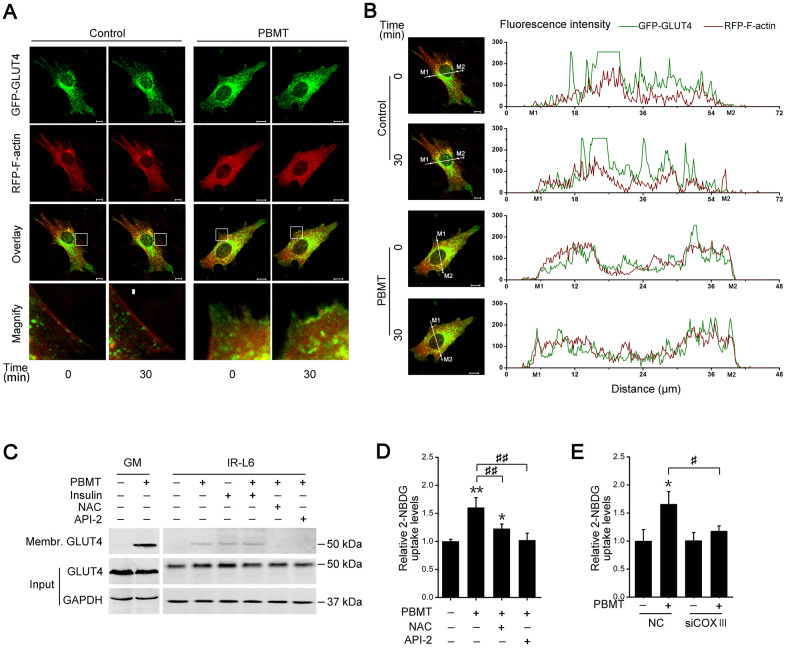
Figure 5.
Activation of AKT signaling promotes glucose transporter GLUT4 translocation after PBMT. (A, B) Representative images (A) of GFP-GLUT4 (green) subcellular localization (red, RFP-F-actin) were obtained in IR-L6 myotubes treated with or without 8 J/cm2. The red areas of the RFP-F-actin images show the cell contour. Fluorescence intensity (B) of GFP-GLUT4 and RFP-F-actin along the white lines in fluorescence images of IR-L6 myotubes. M1 and M2 are cell boundaries. Scale bar, 10 μm. (C) Immunoblot analysis of GLUT4 in the cell membrane fraction of fresh GM and IR-L6 myotubes 30 min after 8 J/cm2 PBMT or 10 nM insulin treatment. Cells were pre-cultured with NAC (250 μM) or API-2 (2 μM) 1 hour before PBMT. (D) 2-NBDG uptake in IR-L6 myotubes 30 min after PBMT in the presence of either NAC or API-2. Mean ± SD, n = 3. *p < 0.05, **p < 0.01 vs. the PBMT-untreated group; ##p < 0.01 vs. the indicated group (Student’s t-test). (E) 2-NBDG uptake in IR-L6 myotubes transfected with NC or COXIII siRNA 30 min after the indicated treatments. Mean ± SD, n = 3. *p < 0.05 vs. the PBMT-untreated group; #p < 0.05 vs. the indicated group (Student’s t-test).

