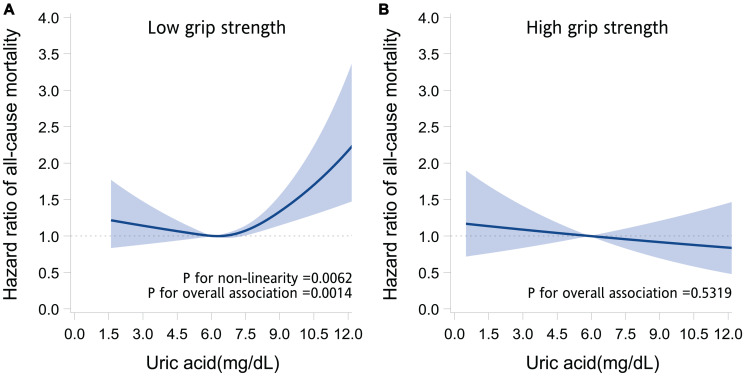
Figure 1.
Association between serum uric acid and the risk of death. The graphs present the adjusted hazard ratios of all-cause mortality for serum uric acid levels in older adults with low grip strength (A) and high grip strength (B). The hazard ratios (solid line) and 95% confidence intervals (band) were estimated by fitting restricted cubic spline Cox regression models, in which uric acid was modeled as a continuous variable with splines having 4 knots placed at the 5th, 35th, 65th, and 95th percentiles. Models were adjusted for age, sex, marital status, behavioral characteristics, body mass index, chronic diseases, and use of uric acid–lowering drugs.

