
Figure 2.
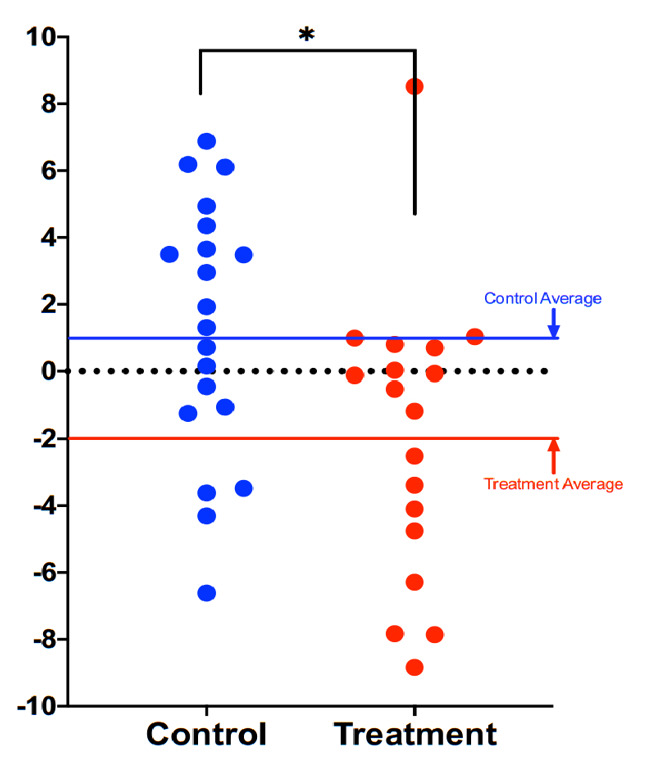
Comparison of DNAmAge change between treatment and control groups. Each dot is a subject, and the vertical axis represents difference in DNAmAge from the beginning to the end of the eight-week term. Participants scored an average 1.96 years younger, controls an average 1.27 years older. The age reduction of the treatment group strongly trended towards significance (p=0.066), while the age increase of the control group itself was not significant (p=0.153). The difference between control and treatment groups was significant at the level p=0.018 (unpaired two-tailed t-test). Long red and blue lines represent group averages (mean).