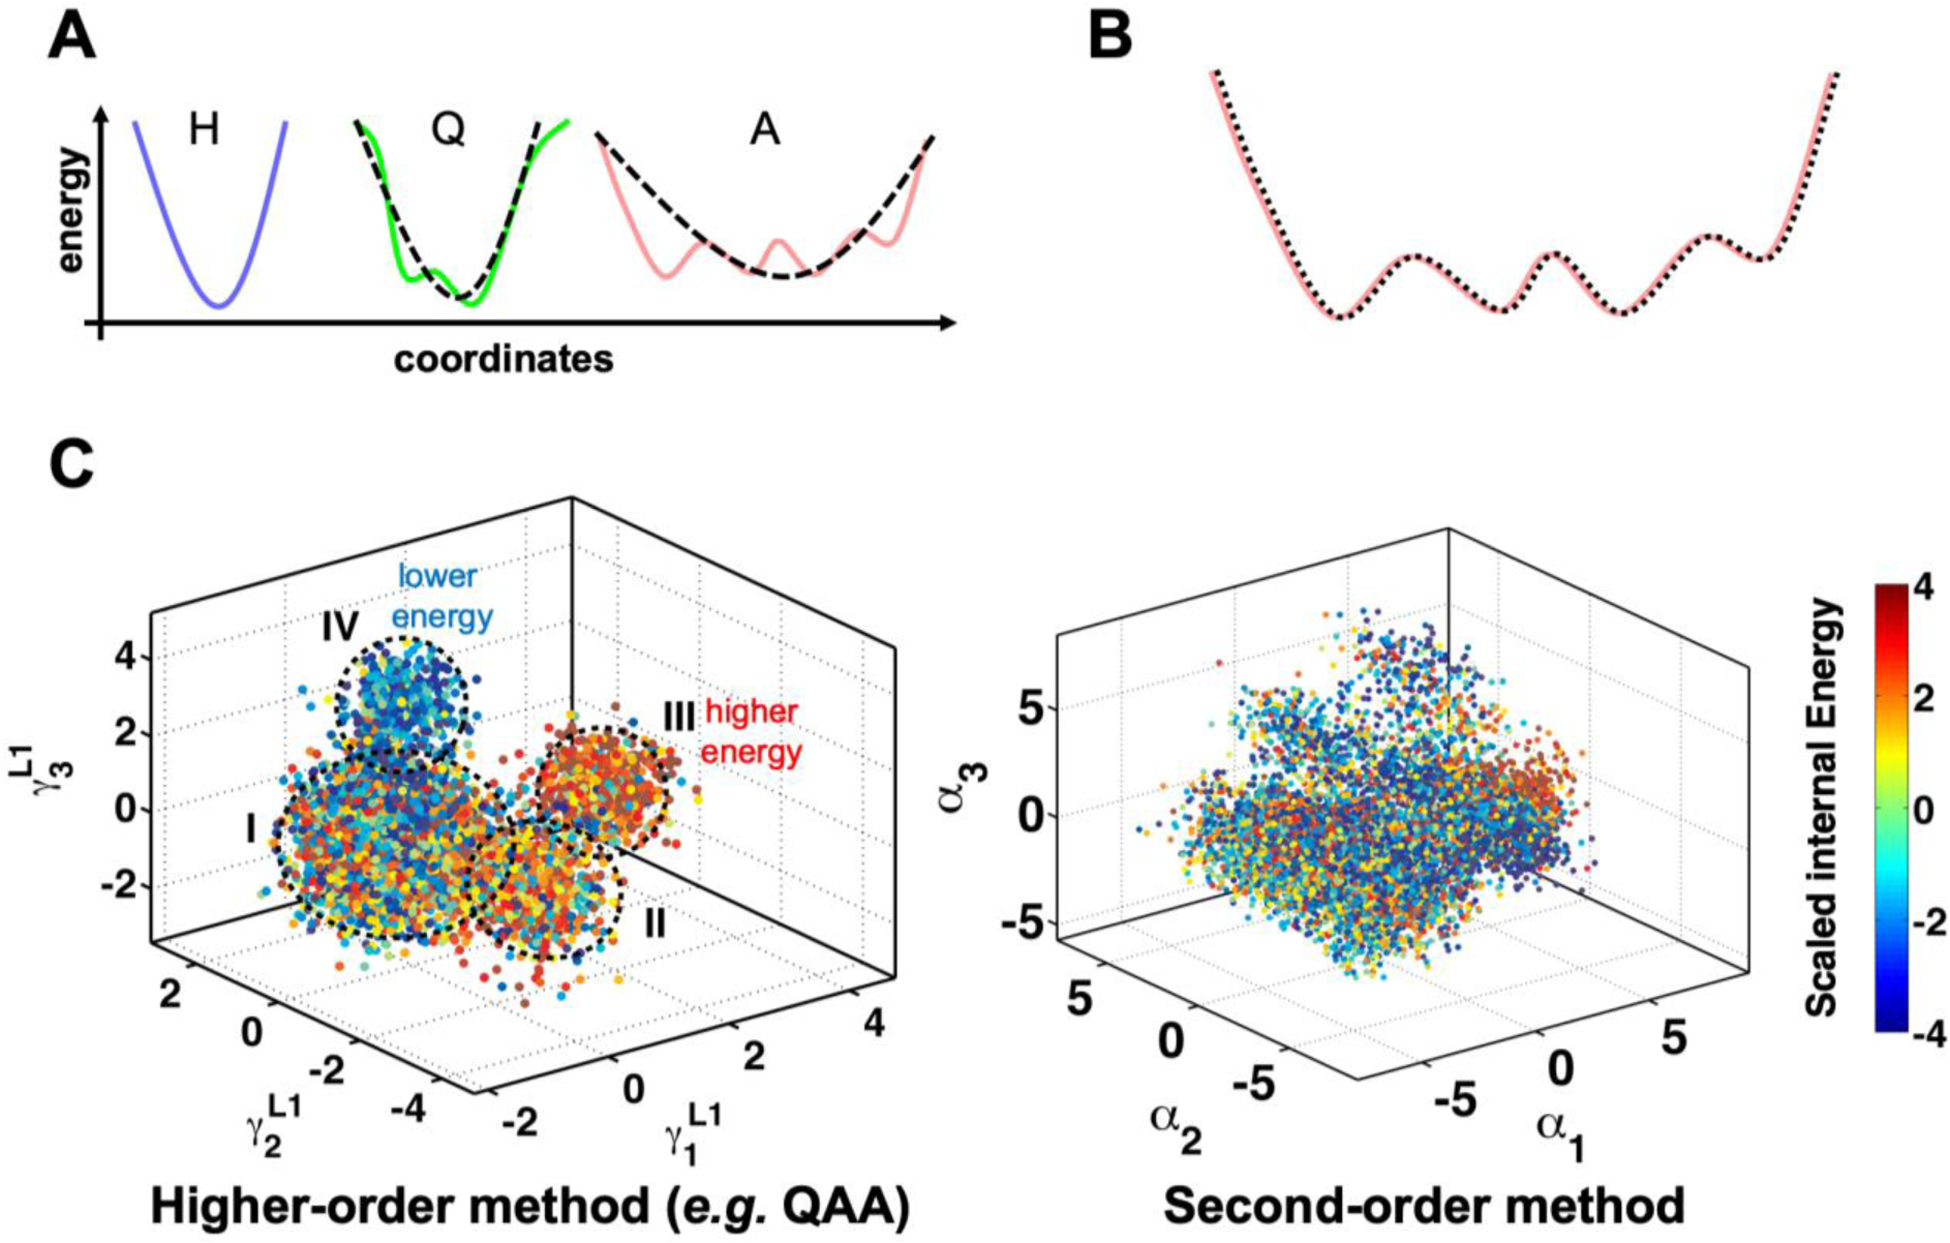
Figure 3: Higher-order statistical methods are required to correctly identify slower motions and conformational sub-states in proteins.

(A) Motions can be harmonic (indicated by blue curve and marked by H), quasi-harmonic (green curve, Q) or anharmonic (pink, A). Second order methods such as principal component analysis and normal mode analysis are based on fitting a quadratic equation such as the one shown by black dashed line. Good fits for H and Q can be obtained with second-order methods. However, for anharmonic motions, the second-order methods provide poor approximations. (B) Higher-order methods such as quasi-anharmonic analysis (QAA)(54b) equate to fitting higher-order polynomials (indicated by dashed black line) to the protein anharmonic motions. (C) Conformational heterogeneity in protein conformational sub-states as identified by higher-order methods provides homogeneous separation, while second-order methods fail to provide this separation. Each dot represents a single protein conformation, which is colored by internal energy (the conformations can also be classified by any other property such as distance or angles). Note that the QAA-based method correctly identifies the lower energy (IV) and higher energy (III) states relative to the other two sub-states (I and II) with mixed energy conformations.
