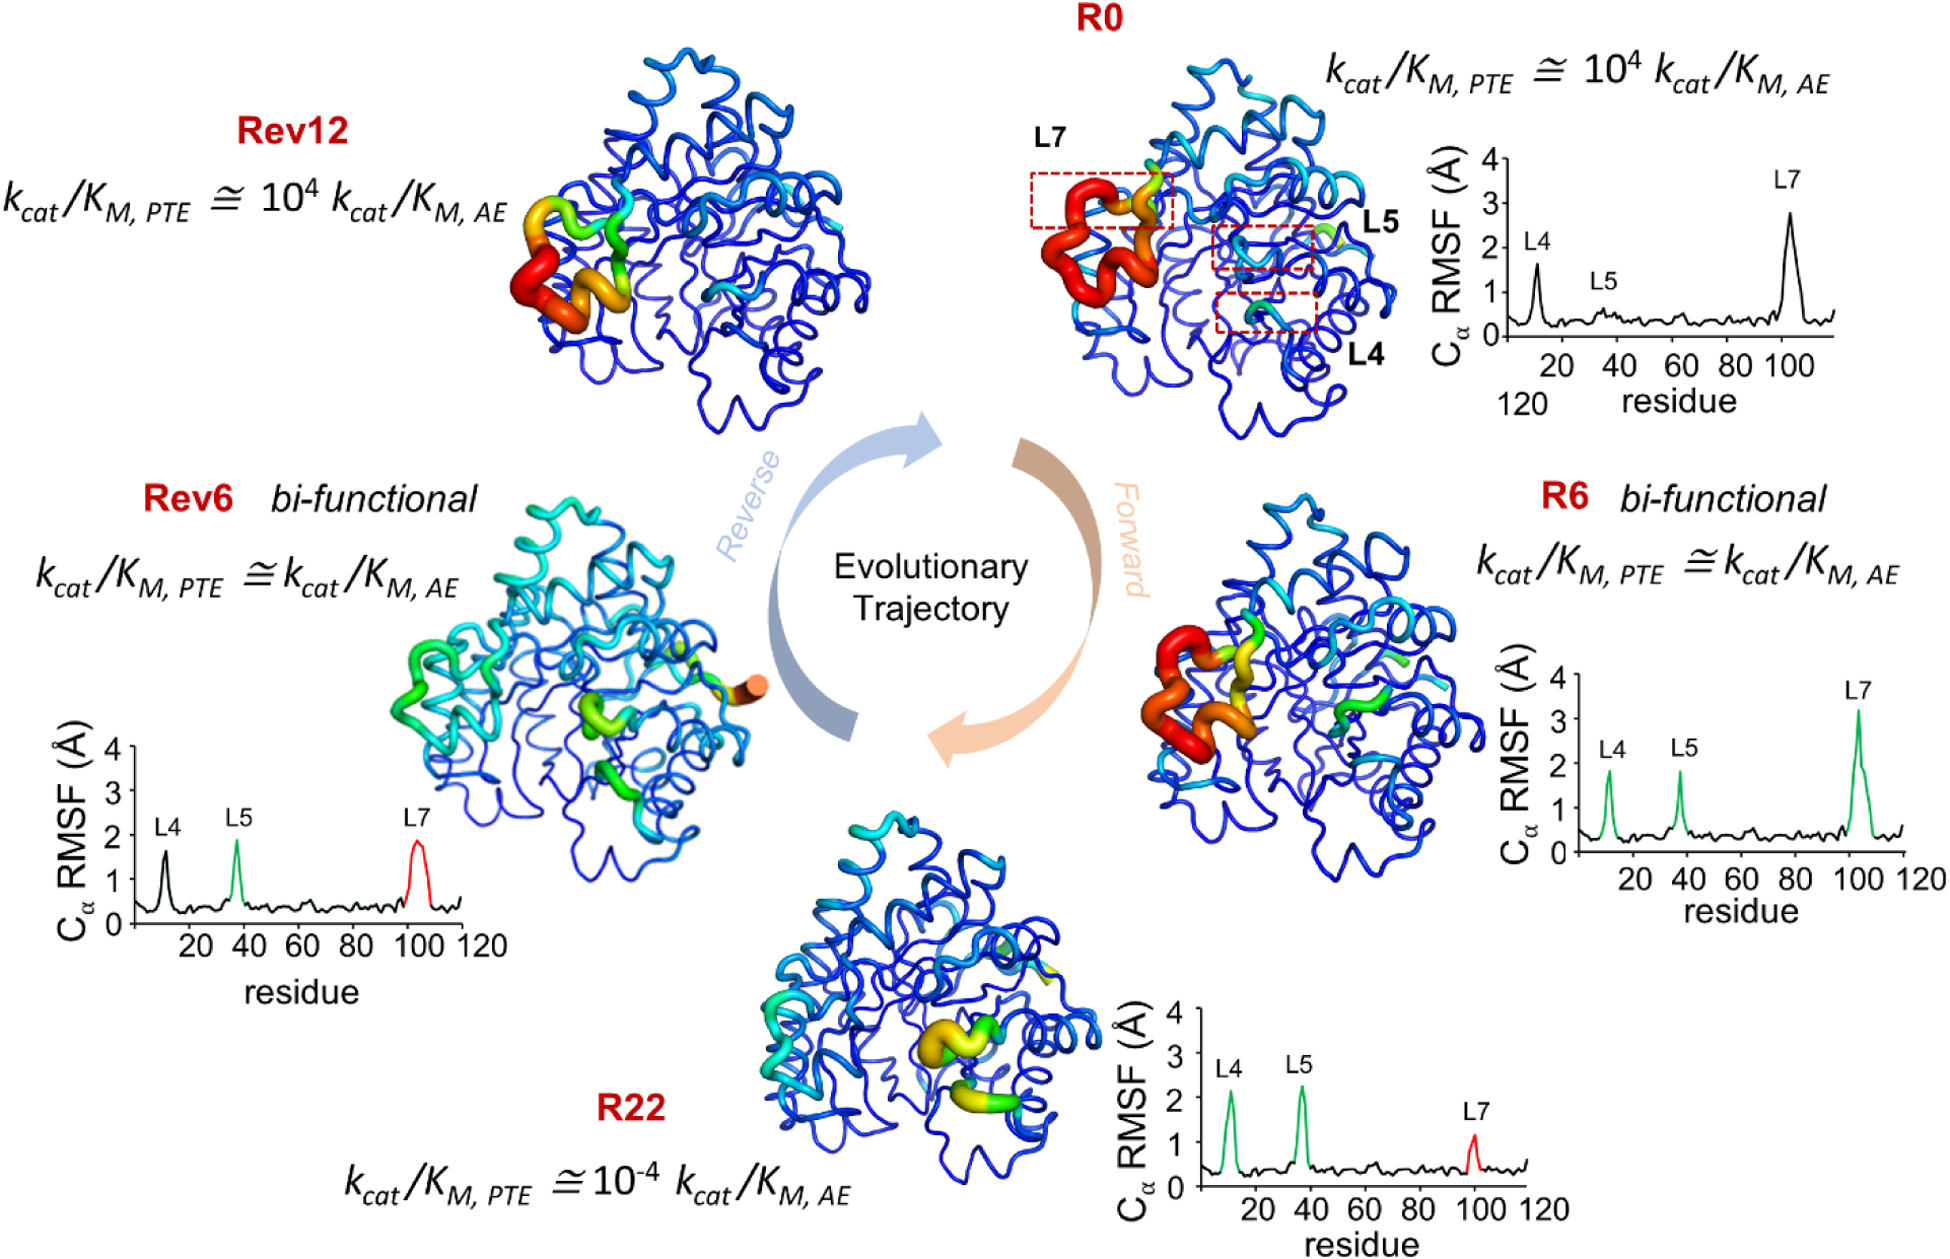
Figure 6: Changes in enzyme dynamics and function over evolutionary trajectory.

Jackson and coworkers (86) investigated development of arylesterase activity (AE) by an enzyme which had native phosphotriesterase (PTE) activity. They reported increase in dynamics of loops L4 and L5, while decrease in dynamics of L7 during the evolution of new function (from R0 with native PTE activity to R22 with primarily AE activity). While in the reverse evolution trajectory, the dynamics of L7 increases while dynamics of L4 and L5 is reduced. R0 and Rev12 showed ~104 higher catalytic efficiency (kcat/KM) for PTE, while R22 shoed s ~104 higher kcat/KM for AE. Bifunctional intermediates R6 and Rev6 have equivalent efficiency for both functions, and sample conformations similar to both start and end points of the evolutionary trajectory. Increasing B-factor of individual residue is represented as width of the cartoon putty. RMSF of Cα atom of each residue is plotted, green peaks represent increase in dynamics while red peaks represent decrease in dynamics as compared to R0. kcat/KM ratio of PTE to AE activity is reported. Figure adapted from (86).
