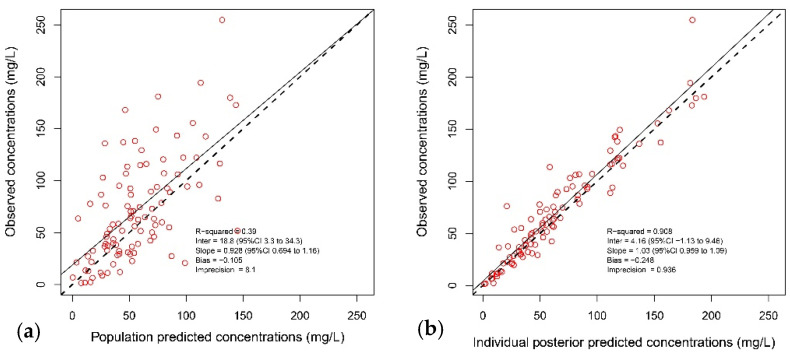
Figure 1.
Diagnostic plots of the final population pharmacokinetic covariate model. (a) Observed piperacillin concentrations versus population predicted concentration (R2 = 0.39); (b) observed piperacillin concentrations versus individual predicted concentrations (R2 = 0.908). The continuous line represents the regression line, and the dashed line is the line of identity.

