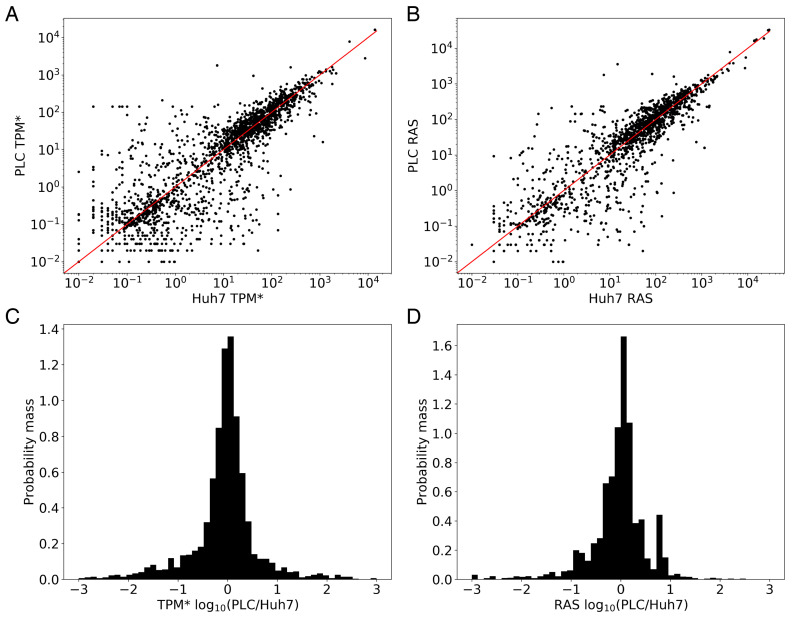
Figure 2.
(A) Correlation of the mRNA levels (in terms of TPM* scores) between the Huh7 and PLC cell lines for all metabolic genes represented in Recon3D. The line PLC-TPM* = Huh7-TPM* represents theoretical identical scores between the cell lines. (B) 2D comparison of the RAS scores (dealing with multi-subunit proteins and isoenzymes) of the Huh7 and PLC cell lines for all metabolic genes represented in Recon3D. (C) Histogram of the probability mass function of the log10 of the ratio of the TPM* scores between the two cell lines (PLC relative to Huh7) shown in (A). (D) Histogram of the probability mass function of the of the ratio of the RAS scores between the two cell lines (PLC relative to Huh7) shown in (B).

