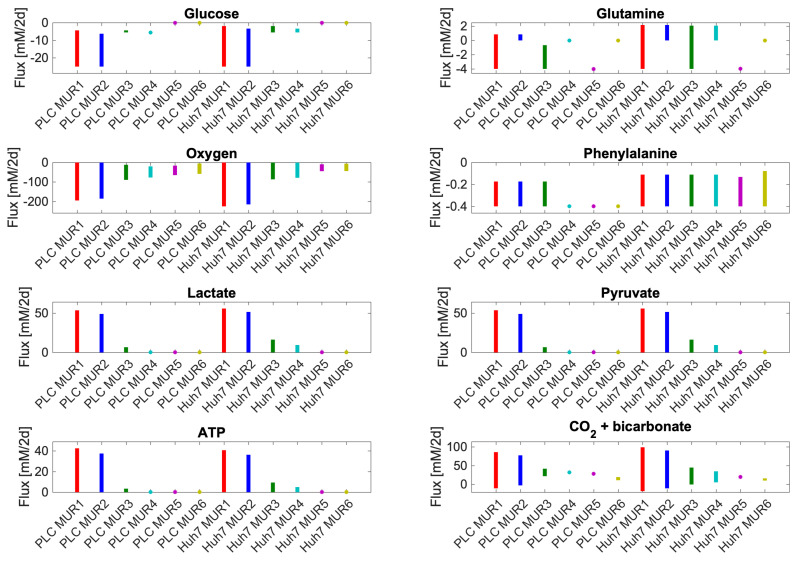
Figure 4.
The range of uptake (if negative) / secretion (if positive) fluxes of various metabolites: computed to be consistent with maximal biomass flux and steady-state. Uptake and secretion fluxes of metabolites have units of mM/h. Since we set maximal uptake fluxes equal to medium concentrations these rates differ from reality by some undetermined factor which is identical for all conditions. Minimal and maximal exchange fluxes for each of the compounds lactate, phenylalanine, glutamine, pyruvate, oxygen (O) and CO + bicarbonate and ATP hydrolysis flux (i.e., ATP + HO => ADP + P + H), were calculated using flux variability analysis [61] while requiring the model to produce the same maximum possible biomass fluxes shown in Figure 3. Maximal glucose and glutamine uptake fluxes had been set to their medium concentrations divided by 2 days (see Table 1 in Material and Methods). In these calculations, ATP is treated differently from the others. For the others, the reaction was and remained present and potentially carrying varying flux when any of the yet other fluxes was manipulated in the FVA. For the ATP, the ATPase reaction was absent (no growth rate-independent maintenance, therefore) when doing FVA for any of the others and only present when ATP synthesis was manipulated by forcing flux through an ATP hydrolyzing added reaction. For visibility, we used starred markers to indicate small flux ranges. These markers are typically located at minimal or maximal flux boundaries, e.g., zero glucose uptake in NA5 and NA6 or maximal phenylalanine uptake in PLC NA4. Uptake and secretion fluxes of metabolites have units of mM/2d.

