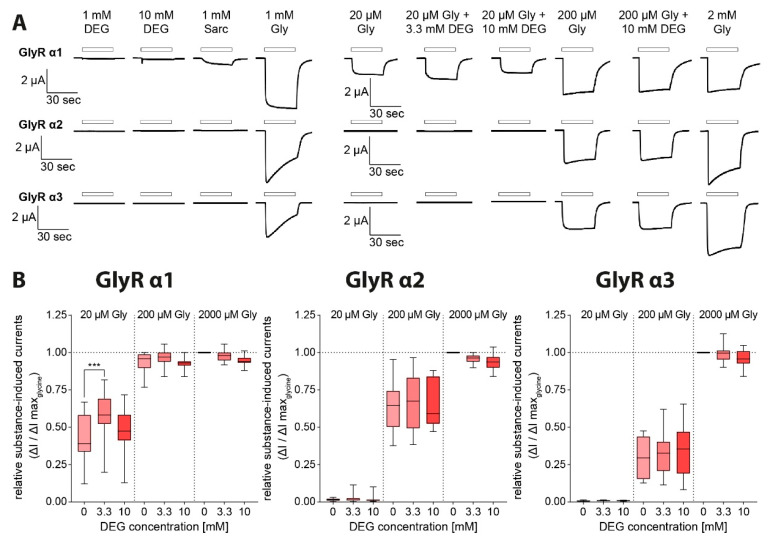
Figure 6.
Current response of GlyRα1-3 after DEG application with and without glycine. (A) Original traces of electrophysiological measurements in Xenopus laevis oocytes expressing GlyRα1-3 individually after superfusion with DEG solution in increasing substance concentration (100 µM, 333 µM, 1 mM, 3.3 mM, 10 mM), sarcosine solution (1 mM) and glycine solution (1 mM) and after superfusion with different glycine solutions (20 µM, 200 µM, 2 mM) additionally containing amounts of DEG (0 mM, 3.3 mM, 10 mM). (B) Relative substance-induced currents of GlyRα1-3-expressing oocytes in relation to the maximum observed current induced by 2 mM glycine (GlyRα1 n = 24–37; GlyRα2 n = 14–30; GlyRα3 n = 12–29; data shown as boxplots, p < 0.001 (***), one-way ANOVA with Bonferroni post-hoc correction).

