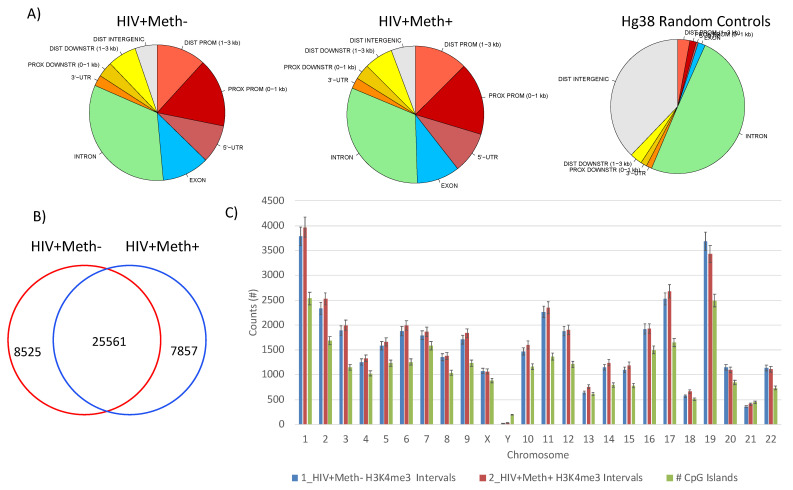
Figure 5.
Mapping of HeK4me3 active genomic regions in human postmortem brain specimens. (A) Pie charts showing the distribution of H3K4me3 in gene sequences in both groups, with genome wide frequency of modifications within introns, exons, 5′-UTR, proximal (0–1 kb) and distal (1–3 kb) promoters, distal intergenic promoter regions, proximal (0–1 kb) and distal (1–3 kb) downstream regulatory regions and 3′-UTR. As a control, randomly located peaks were also ran against the same genomic features database using the entire interval region aligned to the Human Hg38 genome assembly. (B) Venn’s diagram showing genome wide exclusive and mutual merged active regions in HIV+Meth- and HIV+Meth+ cases (n = 3/group). (C) Number of HeK4me3 active peak intervals and CpG islands per chromosome in averaged HIV+Meth- and HIV+ Meth+ cases.

