Figure 9.
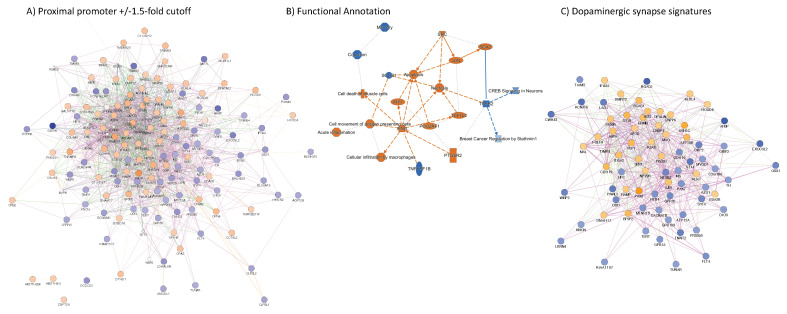
Network of genes with significant changes in H3K4me3 dynamics within the proximal promoter in HIV+Meth+ postmortem prefrontal cortex specimens compared to HIV+Meth-. (A) A weighted gene network from in-promoter enrichment patterns filtered to +/−1.5-fold differences, where circles in shades of blue indicate decrease, and shades of orange indicate enrichment, with relationships based on genetic interactions (pink edges), physical interactions (red edges) and pathway (green edges). (B) Functional Annotation derived from IPA related to genes with in-promoter modifications and prediction of transcriptional regulators. Edges indicate directional molecular and pathway (orange) and biological processes (blue) relationships. (C) Subnetwork containing dopaminergic synapse signatures showing in-promoter modifications, identified by grouped by genetic interactions (pink edges), physical interactions (red edges) and pathway (green edges) (KEGG, p = 3.9 × 10⁻⁶). Node sizes represent connection scores. Blue colors indicate decrease and orange indicates increase in H3K4me3 peak signals in averaged HIV+Meth+ compared to HIV+Meth- prefrontal cortex specimens.

