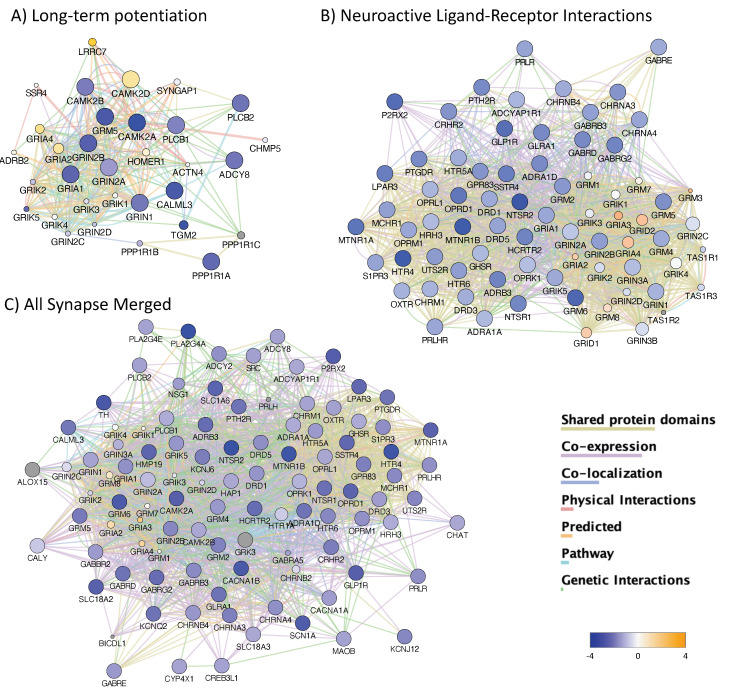
Figure 12.
Gene clusters annotated to neurological functions. (A) Long-term potentiation (p = 1.4 × 10⁻⁴, Benjamini = 6.2 × 10⁻³). (B) Neuroactive ligand-receptor interactions (p = 6.6 × 10⁻¹⁸, Benjamini = 3.3 × 10⁻¹⁶). (C) Merged synaptic clusters indicating redundancy and common interactions. Clusters in Figure 11 and Figure 12 showed a 52.7% overlap and 100% connectivity in merged features. Node sizes represent connection scores. Blue colors indicate decrease and orange indicates increase in H3K4me3 peak signals in averaged HIV+Meth+ compared to HIV+Meth- prefrontal cortex specimens. Gray nodes indicate genes in the pathway for which we have not detected any H3K4me4 peak signal.

