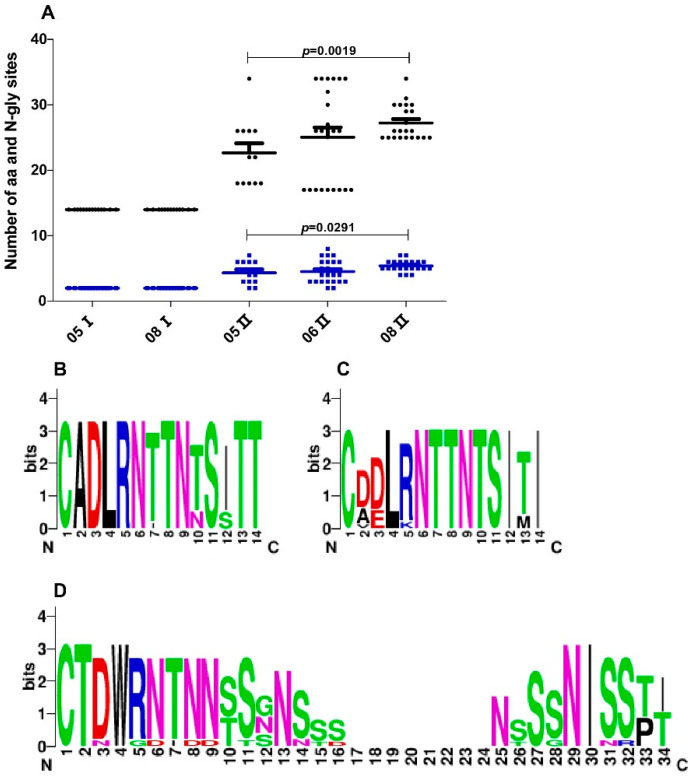
Figure 3.
Comparison of sequence length and potential N-linked glycosylation sites (PNGSs) number of the V1 loop. (A) Longitudinal analysis of changes in the sequence length and the PNGSs number of Cluster I and Cluster II viruses. Each dot represents one virus variant. Black dots represent V1 loop length. Blue dots represent the V1 loop PNGSs number. The horizontal bars indicate average values per time point, and p-values were calculated using a nonparametric t-test for independent samples. (B) Sequence logo of V1 of 2005 Cluster I viruses, which depicts the amino acid conservation pattern across a multiple sequence alignment. The height of each letter indicates the degree of conservation of the most common amino acid at that position. (C) Sequence logo of V1 of 2008 Cluster I viruses. (D) Sequence logo of V1 of 2005 Cluster II viruses.

