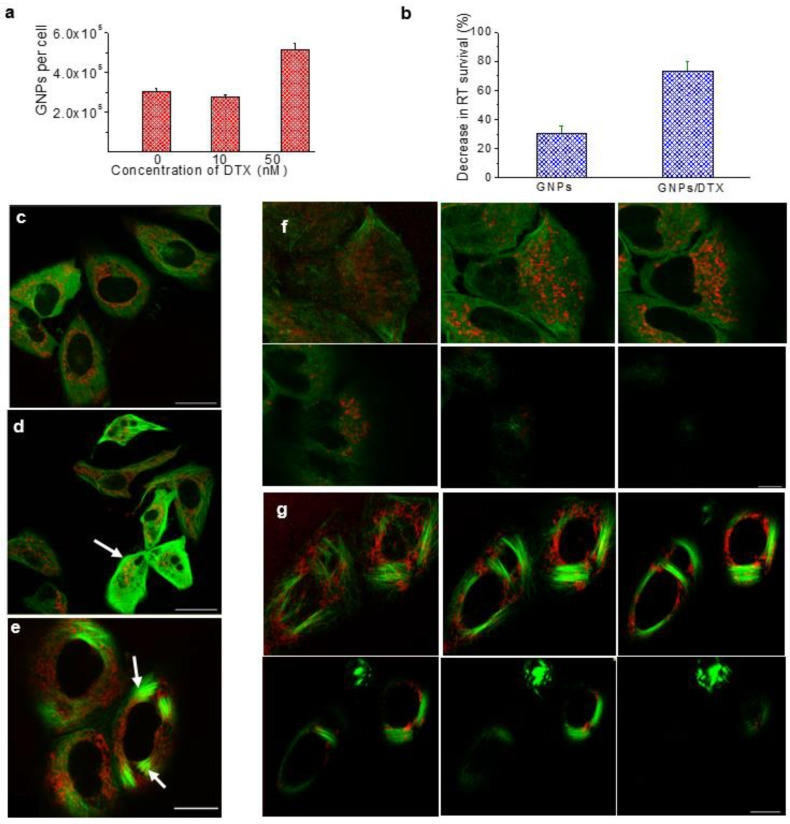
Figure 9.
Triple combination of RT/DTX/GNPs. (a) GNP uptake as a function of DTX concentration in HeLa cells (24 h exposure). (b) Comparison of percent decrease in survival fraction in RT with the addition of GNPs vs. GNPs/DTX in HeLa cells (Adapted from Bannister et al. [39]). (c–e) Confocal images of GNPs (in red) and microtubules (in green) in HeLa cell with the exposure 0, 10, and 50 nM of DTX, respectively. (f,g) The distribution of GNPs across few planes of HeLa cells treated with 0 and 50 nM of DTX, respectively. The scale bar is 25 µm. Reproduced from [86], MDPI, 2020.

