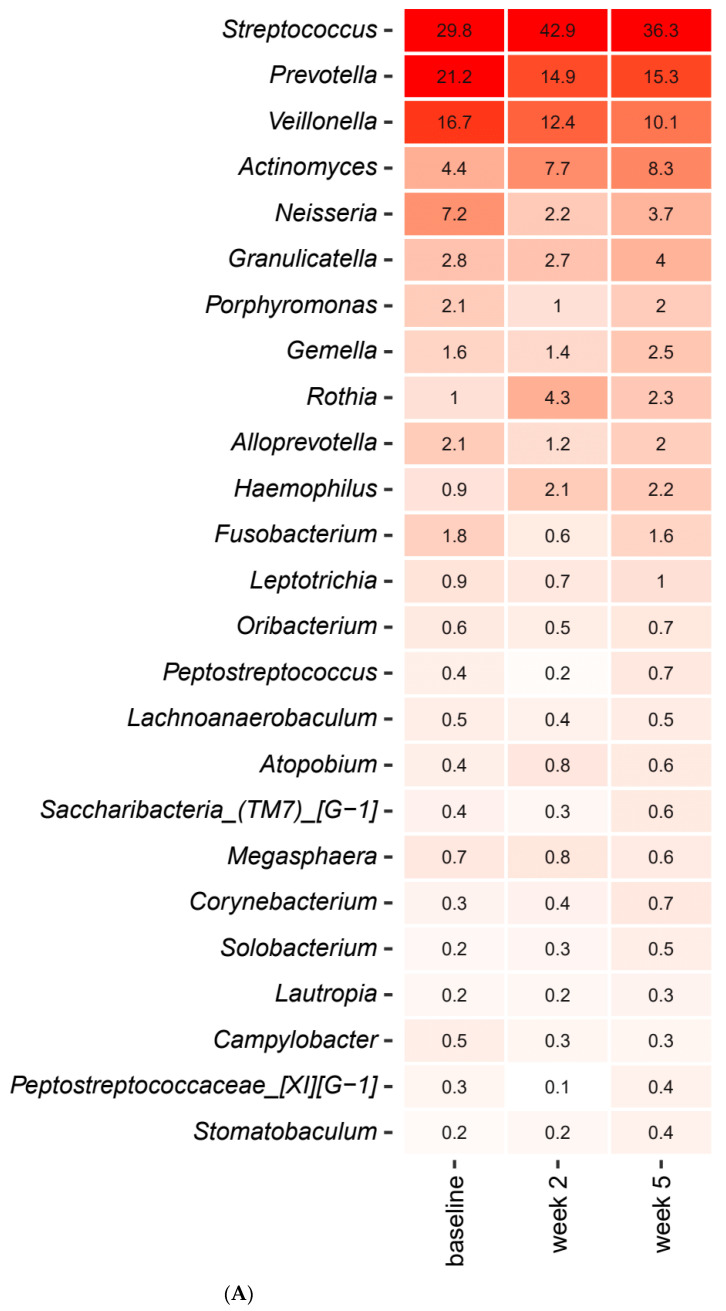
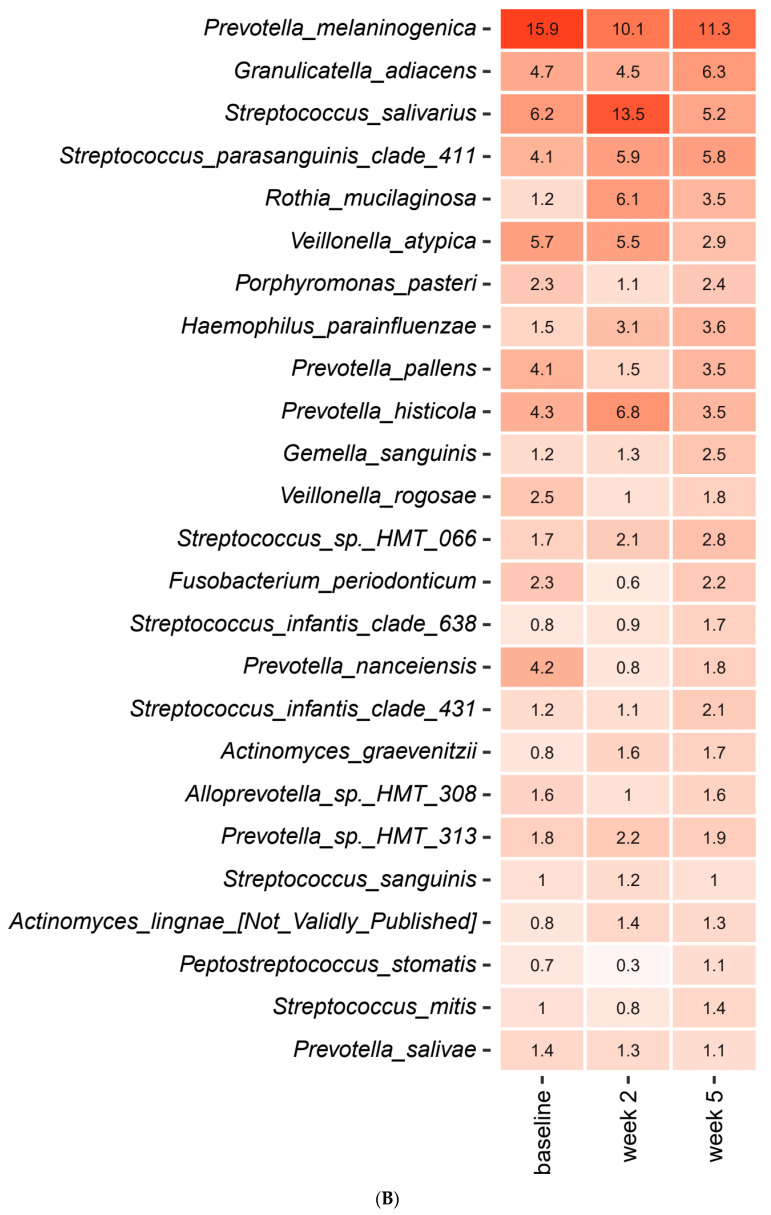
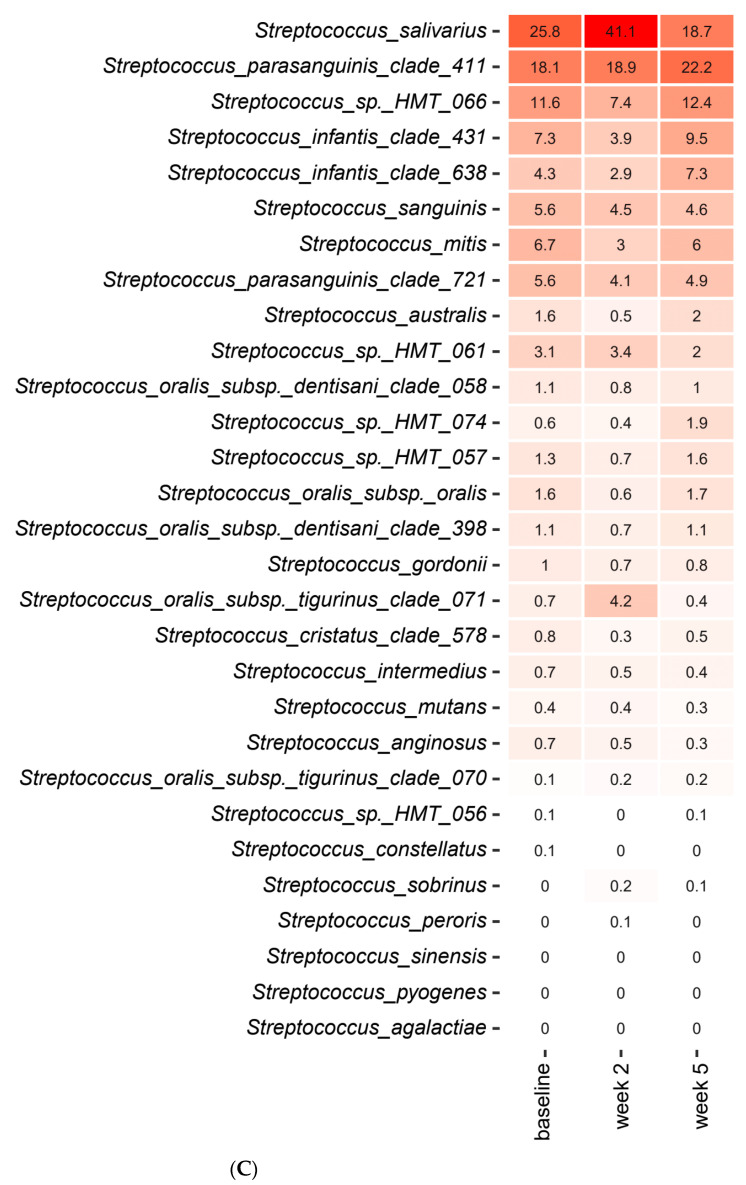
Figure 1.
Impact of sugar stress on predominant microbiota. Mean values of relative abundance of top 25 predominant genera (A), species (B) and Streptococcus species (C) in the sucrose and placebo group recorded at baseline, week 2 and week 5. The intensity of the red color denotes the level of relative abundance.


