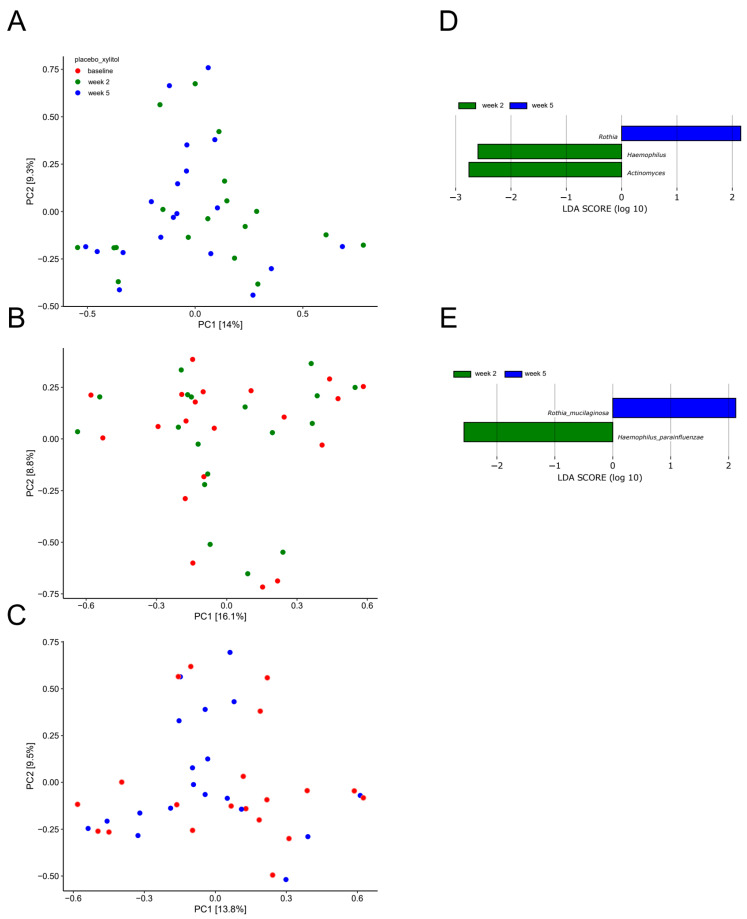
Figure 4.
Compositional stability during xylitol stress. PCA expressed by the two most decisive variables (PC1 and PC2) accounting for approx. 23% of the variation of the dataset in the xylitol and placebo group. (A) baseline vs. week 2. (B) week 2 vs. week 5. (C) baseline vs. week 5. LEfSe analysis expressed by significant genera (D) and species (E).

