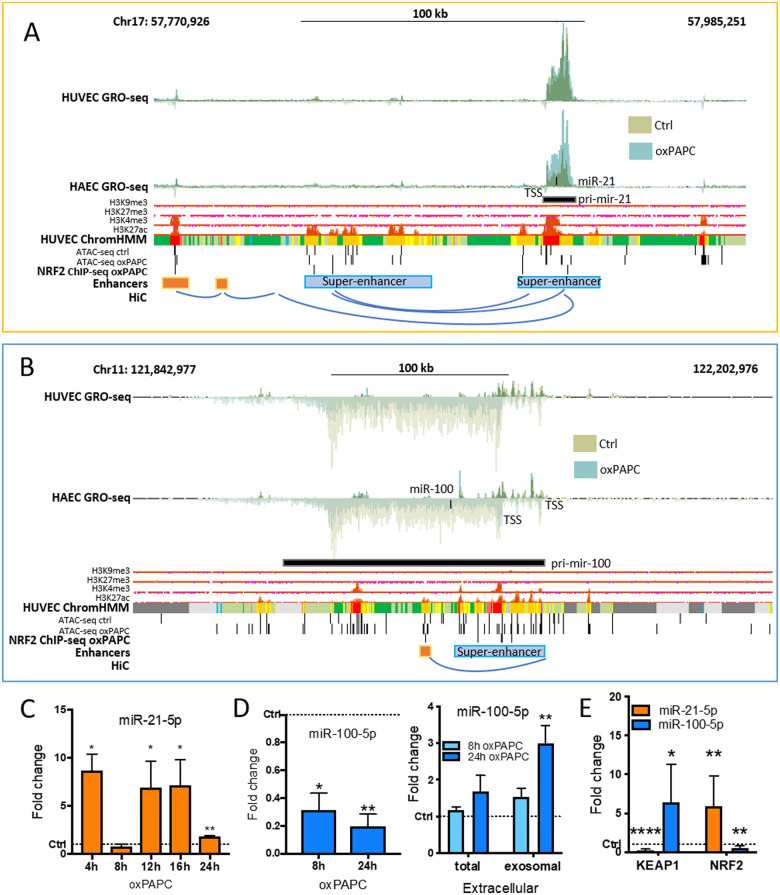
Figure 5.
Detailed analysis of NRF2-regulated miR-21-5p and miR-100-5p expressions. Genomic loci of mir-21 (A) and mir-125b-1/let-7a-2/mir-100 cluster (B). Histone and chromatin segmentation data are ENCODE data32 from UCSC Genome Browser.24 Chromatin segmentation track shows promoters in red, enhancers in orange, and active chromatin regions in green. AREs are determined using previously published tool.11 HiC interactions were visualized with WashU Epigenome Browser.25 (C) miR-21-5p expression in HUVECs under oxPAPC stimuli for indicated times compared to control samples. (D) miR-100-5p expression in HUVECs under oxPAPC stimuli for indicated times compared to control samples, and extracellular miRNA expression measured from the growth media of oxPAPC-treated cells and from the exosomes extracted from the growth media compared to control samples. (E) miRNA expression in KEAP1 and NRF2 overexpressing cells. (n = 3, mean ± SD, unpaired two-tailed t-test, ****P < 0.0001, **P < 0.01, *P < 0.05).

