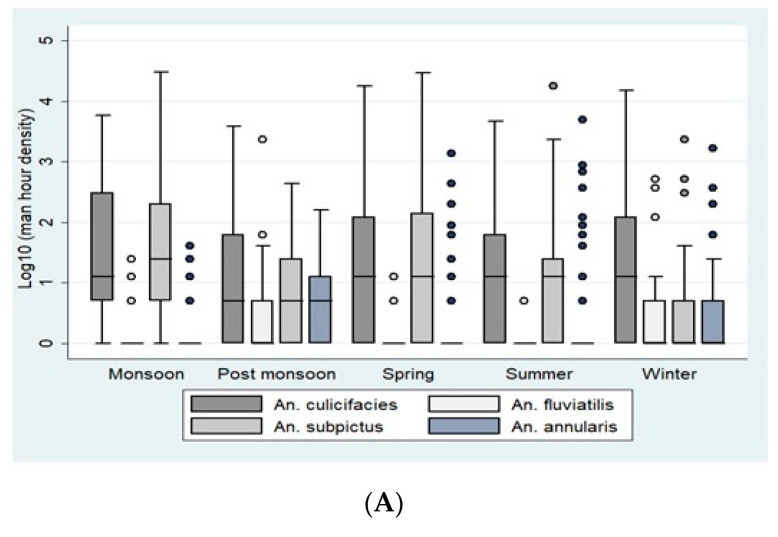
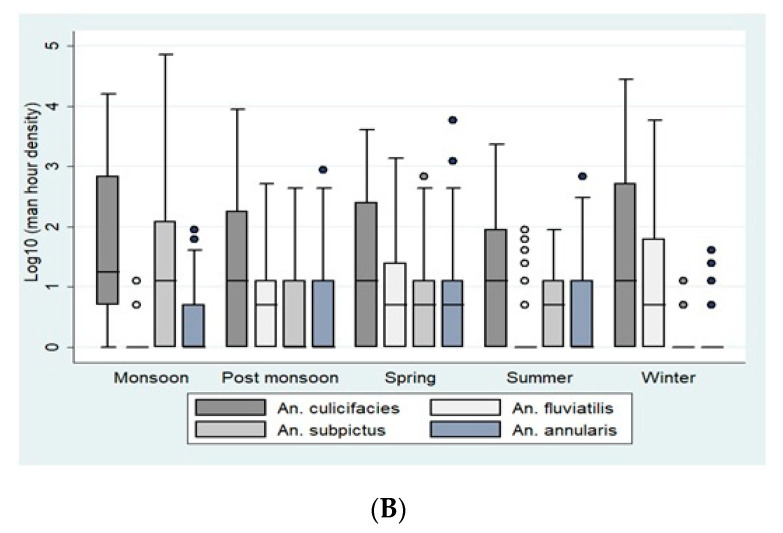
Figure 1.
(A). Season-wise average per man-hour density (indoor resting collections) in Bastar. (B). Season-wise average per man-hour density (indoor resting collections) in Korea district. The boxes in the plots correspond to the log-transformed values of man-hour densities of An. culicifacies, An. fluviatilis, An. subpictus, and An. annularis across different seasons. The densities are represented in the boxes as Quartile 1, median, and Quartile 3. The whiskers represent the highest and the lowest densities.


