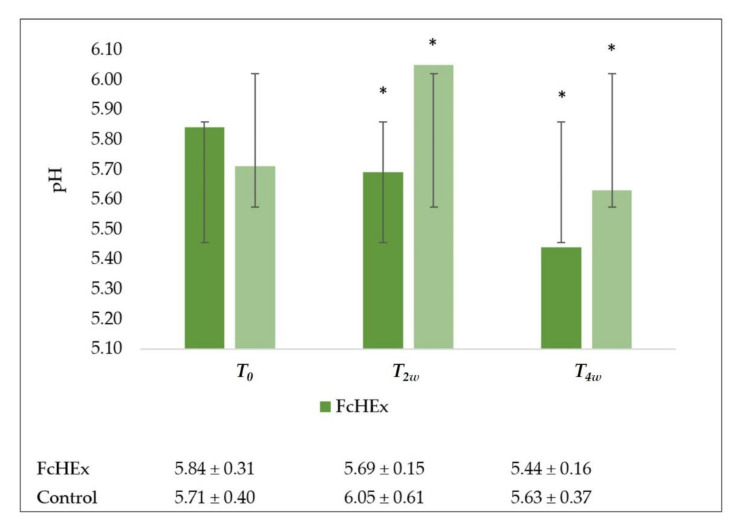
Figure 13.
Skin pH evaluation. The skin pH trend values at time T0 (time of application), T2w (after two weeks—acute stress), and T4w (after four weeks—recovery effect). All the measures for T2w vs. T0 and T4w vs. T0 for the FcHEx and the control were statistically significant. The asterisks indicate statistically significant values (* p-value was between 0.01 and 0.05).

