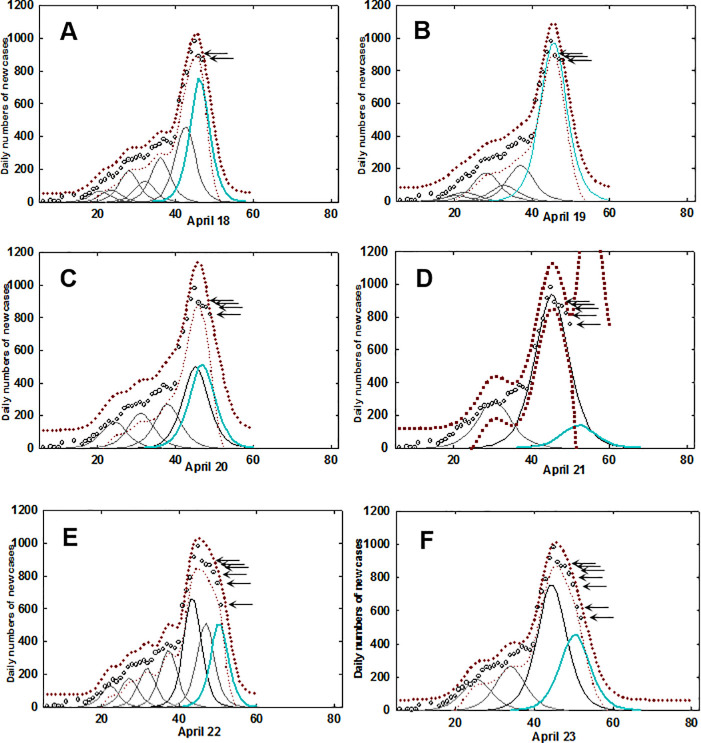
Fig 3. Fitted logistic curves with prediction intervals for Ireland.
A-F: Individual daily time course from April 18 to April 23 for data from Ireland. Circle (5-day averaged daily confirmed infections), prediction intervals (brown dotted trace), fitted curves (black), most time recent fitted curve (cyan). Arrows indicate daily new data points. See S1 Movie for the complete dataset.

