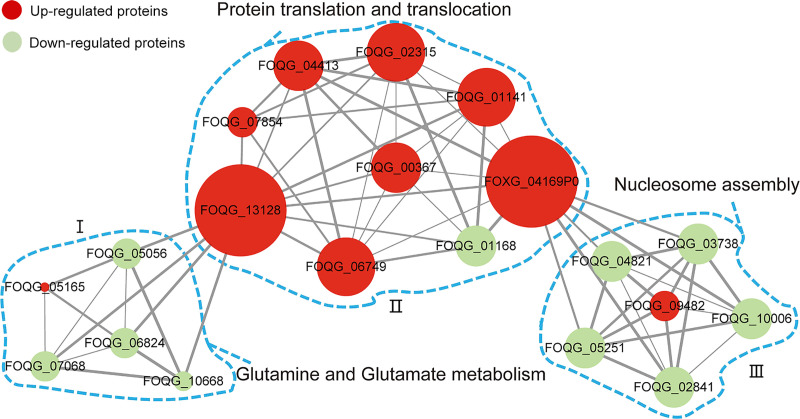
Fig 5. Analysis of protein-protein interaction network for differentially expressed proteins.
The nodes represent proteins (down-regulated and up-regulated), and edges represent interaction between proteins. Node size and edge width indicate the number of connected nodes and the strength of interaction, respectively.

