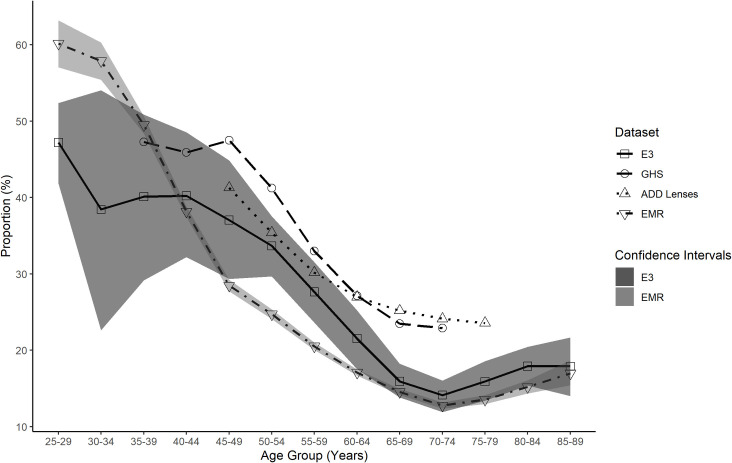
Fig 7. Total myopia proportion for all data sets as a function of age group.
Total myopia proportion for EMR (inverted triangle), ADD Lenses (triangle), GHS (circle) and E3 (square) data as a function of age group. The E3 data confidence intervals (dark shaded area) are plotted to illustrate comparison with the other data sets. The EMR data confidence intervals (light shaded area) are plotted to show the overlap with the E3 data.

