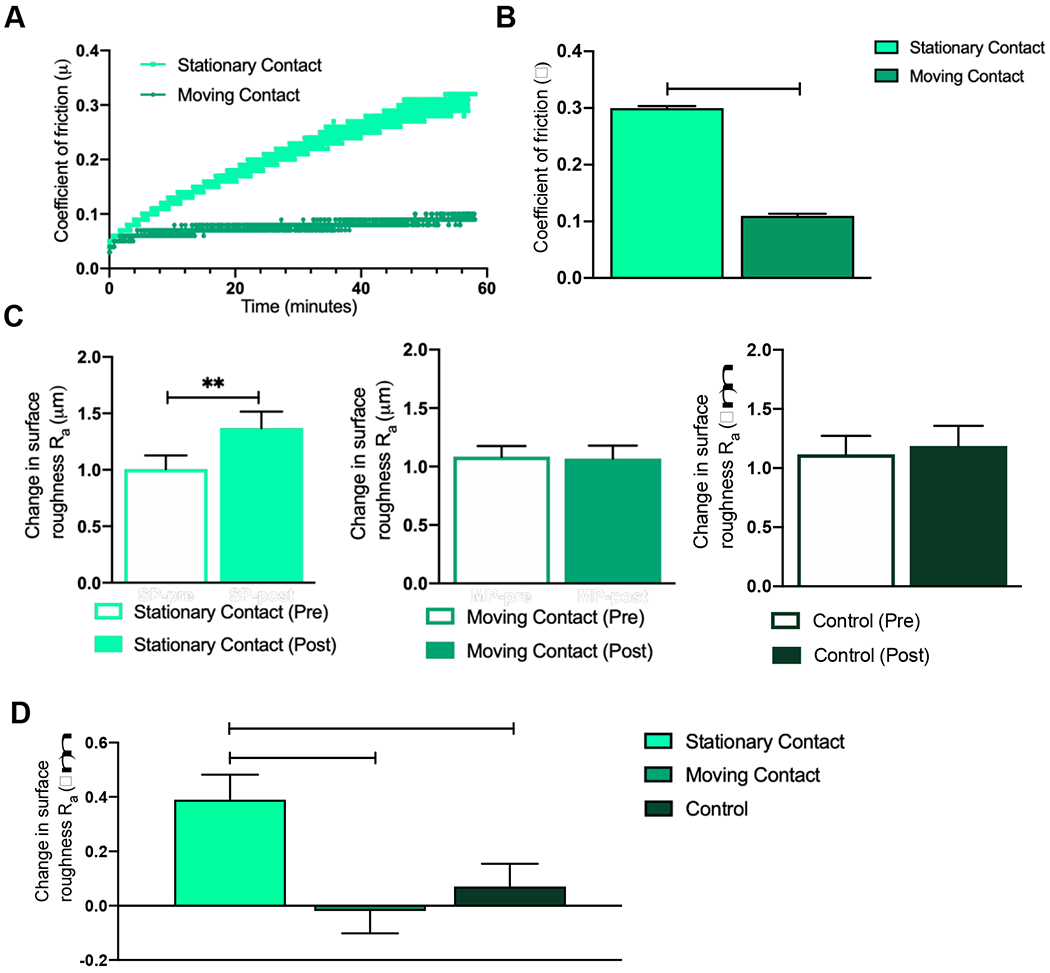
Figure 6. Influence of articulation type on coefficient of friction and surface roughness of articular cartilage.

A) Change in coefficient of friction over time is higher in the SC group as compared to the MC group. B) SC group had the highest coefficient of friction over 60 minutes as compared to the MC group. C) Change in surface roughness was increased in the SC group but not increased in the MC or control group. D) Change in surface roughness was increased in the SC group as compared to the MC or control group. Data represented as Mean ± SEM; *p<0.05, **p<0.01.
