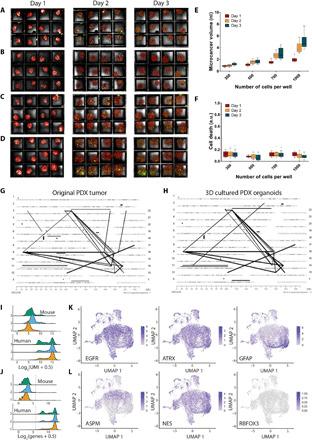
Fig. 2. On-chip PDX culture.

(A to D) Maximum projections of formed microcancers in 12-well culture for days 1 to 3 after cell seeding of 300 (A), 500 (B), 700 (C), and 1000 cells per well (D). Each well has a side length of 300 μm (for scale). Box-and-whiskers plot of microcancer volumes (E) and cell death (green volume normalized to red volume) (F) for each cell variation type for days 1 to 3 after cell seeding (n = 12). Mate pair sequencing demonstrates high degree of relatedness and similar genomic abnormalities in original PDX (G) and 3D cultures (H) grown in our array platform. Assessment of cellular identity and diversity of microcancers (n = 7653) was evaluated through single-cell RNA sequencing. (I) Distributions of UMI counts in GEM cells. Summed UMI counts from mouse genes (top) and human genes (bottom). (J) Distributions of numbers of genes with >1 UMI in each GEM cell. Total number of mouse genes with >1 UMI (top) and human genes with >1 UMI. Line shows threshold of 64 genes detected (6 on log2 scale). Each dot represents the transcriptome of a single cell from dissociated microcancers. (K) and (L) show the single-cell gene expression of key markers for gliomas and glioma stem cells. Scale bars represent z-test–normalized gene counts.
