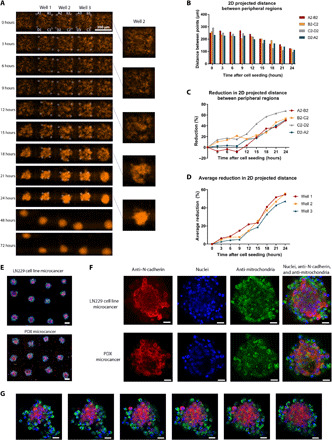
Fig. 3. Capturing real-time microcancer spheroid formation with live cell imaging on an inverted microscope and molecular characterizations of spheroids in microwell array.

(A) Time progression of formation of five microcancers (LN229 cells) on our platform, imaged on an automated inverted microscope culture setup every 3 hours. Scale bar, 300 μm. (B) 2D projected distance between peripheral cell clusters in well 2 over 24 hours. These regions are shown in white circles and labeled in (A). (C) Reduction (%) from time “0” in 2D projected distance between peripheral cell clusters in well 2 over 24 hours. (D) Average reduction (%) from time “0” in 2D projected distance between peripheral cell clusters for all three wells over 24 hours. (E to G) Immunofluorescence detection of N-cadherin (red), 4′,6-diamidino-2-phenylindole nuclear staining (blue), and human mitochondria staining (green) in microcancers formed with LN229 cells and PDX. Tile of 12-well culture of LN229 microcancers (top) and PDX microcancers (bottom) imaged directly on chip (scale bar, 100 μm) (E). High-resolution images of individual microcancers for LN229 and PDX (scale bar, 20 μm) (F). Confocal z-stack images of PDX microcancer 3 days after cell seeding. Distance between each z-stack slice is 10 μm (scale bar, 20 μm) (G).
