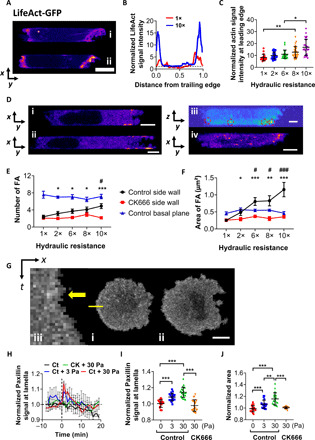
Fig. 2. Hydraulic resistance promotes a thicker actomyosin cortex and larger FAs at the cell anterior.

(A) LifeAct-GFP–tagged cells inside channels of (i) 1× and (ii) 10× hydraulic resistance. Scale bar, 5 μm. (B) Average line scanning profiles of representative cells in (A). All values were normalized by the corresponding cytosolic background values in the geometric cell center. (C) Normalized cortical LifeAct-GFP signal intensity at the cell anterior in channels of prescribed hydraulic resistances. Data represent the means ± SD (n > 20 cells from three experiments). *P < 0.05, **P < 0.01 assessed by Kruskal-Wallis test with Dunn’s post hoc. (D) Paxillin-GFP–tagged cells showing FA localization in a (i) blebbing and (ii) hybrid phenotype at middle focal planes, (iii) blebbing from side view (image reconstructed from z-stack scanning), or (iv) blebbing at basal plane. Scale bars, 5 μm. (E) The number and (F) area of FAs at basal or side walls in the presence or absence of CK666 at different hydraulic resistances. Data are means ± SEM, n > 10 cells from three independent experiments. *P < 0.05, **P < 0.01, and ***P < 0.001 between control and CK666 by two-tailed unpaired t test. #P < 0.05, and ###P < 0.001 relative to 1× using one-way ANOVA with Tukey’s post hoc. (G) Image sequences of paxillin-GFP–tagged cells on 2D (i) before and (ii) after the application of 3 Pa. Scale bar, 10 μm. (iii) Kymograph of line scan shown in (i). Yellow arrow indicates the first frame after hydrostatic pressure loading. (H) Normalized paxillin-GFP signal intensity of control and Arp2/3-inhibited cells on 2D following hydrostatic pressure loading (3 or 30 Pa) at t = 0 min. Signal intensities are normalized to the respective unstimulated controls. Data represent the means ± SEM. (I) Normalized fluorescence intensity and (J) spreading area of paxillin-GFP–expressing control or Arp2/3-inhibited cells immediately (I) and 10 min (J) after hydrostatic pressure exposure. Data represent means ± SD. **P < 0.01 and ***P < 0.001, assessed by two-tailed unpaired t test.
