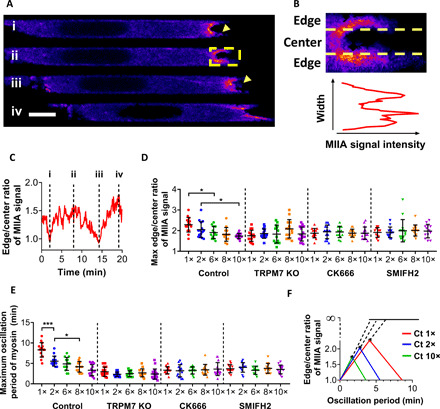
Fig. 5. The spatiotemporal distribution of myosin II at the cell anterior regulated by hydraulic resistance is a key determinant of cell phenotypic transition.

(A) Representative image sequence showing the spatiotemporal pattern of MIIA-GFP at the leading edge of MDA-MB-231 cells during phenotypic transition from blebbing (i and iii) to protrusion (ii and iv). The yellow box outlines the area analyzed in (B). Yellow arrowheads indicate retracting blebs. Scale bar, 5 μm. (B) Top: Yellow dashed lines depict the separation of the cell edge near the side channel wall interface from the center area. Bottom: Average fluorescence intensity profile of the cell cortex. (C) Dynamics of edge-to-center MIIA-GFP fluorescence intensity ratio during the phenotypic transition of the cell in (A). Labels (i) to (iv) correspond to those in (A). (D) Maximum edge-to-center ratio and (E) maximum period of cortical MIIA-GFP oscillation of MDA-MB-231 cells displaying a blebbing and/or hybrid phenotype during phenotypic transition at different hydraulic resistances. Data represent means ± SD for n ≥ 12 control, TRPM7 KO, CK666-inhibited, and formin-inhibited cells from three independent experiments. *P < 0.05 and ***P < 0.001, assessed by one-way ANOVA with Tukey’s post hoc. (F) Using the average values obtained for control cells in (D) and (E), the edge-to-center ratio versus oscillation period of MIIA-GFP was plotted. Asterisks indicate the maximum edge-to-center ratio necessary to retain a blebbing phenotype at different hydraulic resistances. Beyond that threshold, cells transition to a protrusive phenotype.
