
Fig. 2. Mapping WAXS features to real space structural details.
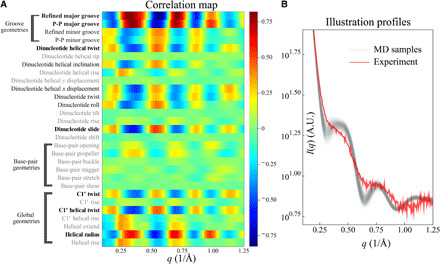
(A) The correlation map between RNA duplex geometries and normalized deviations between experiment and simulation (Eq. 11). The helical parameters with high correlations (∣ρ∣ > 0.5) are highlighted in boldface. (B) WAXS profiles of intermediate MD conformations and experimental data for interpreting the correlation map. Using the correlation map, we qualitatively interpret conformations that correspond to experimental data, despite the mismatch at this intermediate stage. For the profiles shown, the models clearly do not accurately recapitulate features at q values near 0.25 and 0.6 Å−1, suggesting that the intermediate simulations do not capture the correct groove geometries and more rounds of SaS are required. See the main text for details. A.U., arbitrary units.