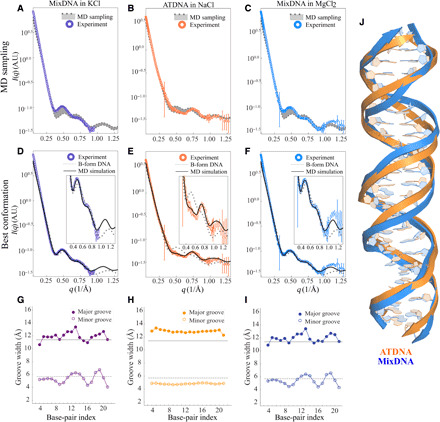
Fig. 3. Solution x-ray scattering profiles of DNA duplexes from experiment and simulation at different salt conditions.

(A) MixDNA duplex in 400 mM KCl, (B) ATDNA in 100 mM NaCl, and (C) MixDNA in 10 mM MgCl2. Conformations sampled from MD simulations (without SaS approach) are shown in the shaded area. (D) to (F) are the same comparison when the experimental profile is compared against the best-fitting conformation (black) and canonical B-form DNA duplex (gray dashed line), respectively. The insets highlight the differences between the profiles at the wide angle. The widths of the major and minor grooves for MixDNA in KCl, ATDNA in NaCl, and MixDNA in MgCl2 are shown in (G) to (I), respectively. In these panels, the solid gray and dashed gray lines correspond to the canonical B-form major and minor GWs, respectively. The x axis gives the residue positions. (J) The comparison of dsDNA conformations obtained from the best-matching models highlights structural variations.
