
Fig. 4. Solution x-ray scattering profiles of MixRNA duplexes from experiment and simulation at different salt conditions.
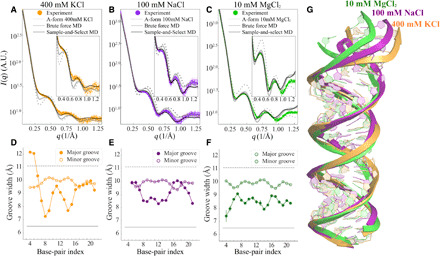
(A) The duplex in 400 mM KCl, (B) 100 mM NaCl, and (C) 10 mM MgCl2, respectively. The dashed gray curve represents the computed profiles from canonical A-form RNA, while the solid gray curve represents the best agreement from MD sampled pool, where the starting conformation is A-form. The black curves show the agreement after SaS approach is used. Traces of major/minor GWs computed from best-fitted conformations for each salt condition, (D) 400 mM KCl, (E) 100 mM NaCl, and (F) 10 mM MgCl2, respectively. The x axis gives the residue positions. The major GW exhibits residue specificity that affects overall RNA duplex conformation. This feature is detectable to WAXS because of its disruption of the structural periodicity in duplex topology. (G) The alignment of conformations in different salt conditions shows structural variations.