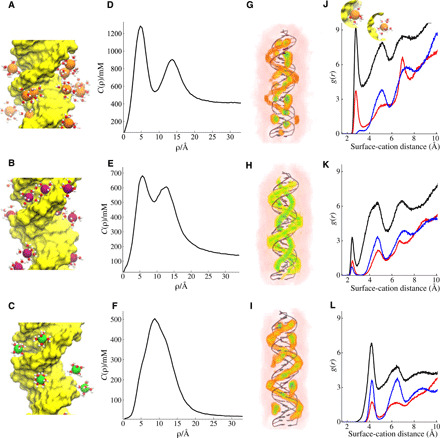
Fig. 5. Cation distributions around DNA duplexes computed from simulations.

(A to C) A snapshot from each simulation setup where only the cations in the vicinity of the DNA with their first solvation shell water molecules are shown. (A) MixDNA in 400 mM KCl, (B) ATDNA in 120 mM NaCl, and (C) MixDNA in 10 mM MgCl2. The average distribution of cations is monitored by cylindrical concentration profiles along the long axis of dsDNA. The solid line represents c(ρ) as a function of the distance from the central axis of the duplex. (D) KCl, (E) NaCl, and (F) MgCl2. 3D ion density plots colored from white (low) to red to green (high) and shown in the same order as (G) KCl, (H) NaCl, and (I) MgCl2, respectively. (J) Radial distribution function of K+ ions from the duplex surface. Different colors represent correlation of cations with different parts of the duplex; (black) with the whole duplex atoms, (red) with major groove, and (blue) with backbone phosphates. The inset in (J) depicts dehydrated (left, first peak) and hydrated (right, second peak) bound states. (K and L) Same as (J), but this time for Na+ and Mg2+, respectively.
