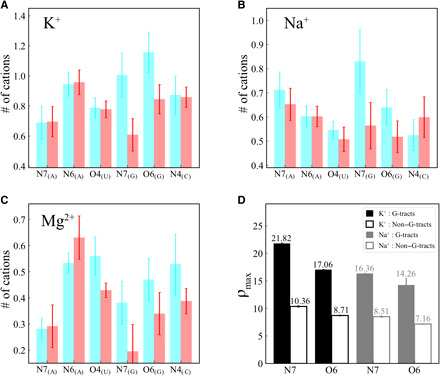
Fig. 9. Nucleobase-level bound cation analysis for MixRNA.

(A) RNA in KCl, (B) NaCl, and (C) MgCl2. (D) The binding strength comparison of monovalent ions to G tracts (solid bars) and non–G tracts (empty bars). ρmax represents the relative binding strength of cation obtained from the maximum of radial distribution function.
