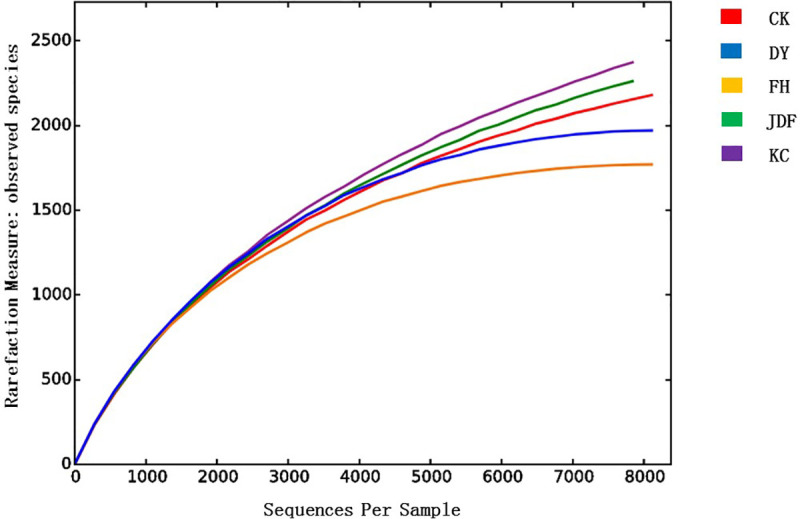
Fig 1. Rarefaction curves based on the observed species in the bacterial communities in maize rhizosphere soil.

The abscissa represents the randomly selected sequencing data. The ordinate represents the number of observed operational taxonomical units (OTUs). When the curve tended to be flat, the amount of sequencing data was reasonable. CK, KC, DY, JDF, and FH groups indicate control, B. subtilis, B. licheniformis, B. amyloliquefaciens, and combined strains treatments, respectively.
