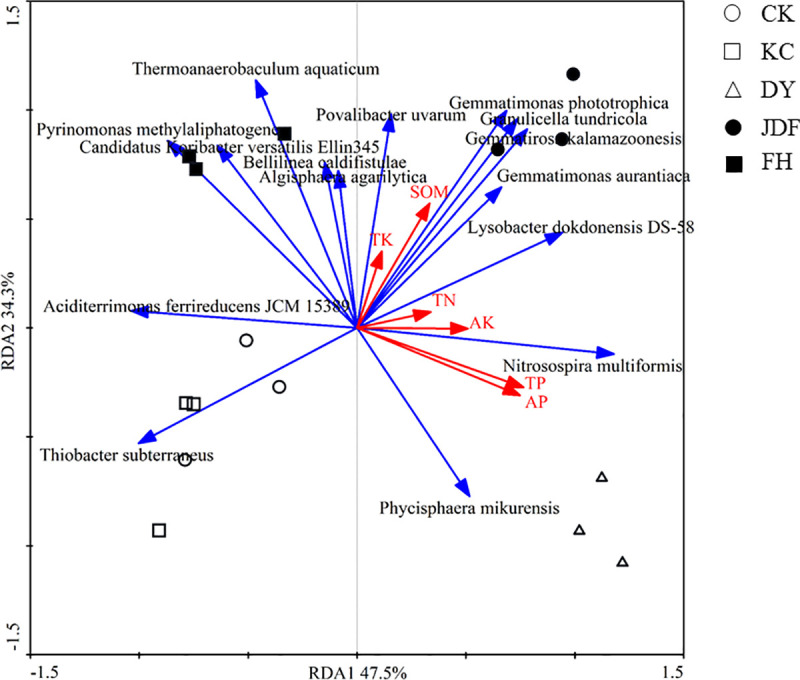
Fig 5. RDA analysis of the correlations between the physiochemical characteristics of the soil and the microbial species in the maize rhizosphere.

The blue arrows represent the strains, and the red arrows represent the properties of the soil. The length of the arrows indicates the degree of correlation between the strain and the sample distribution. The angle between the two arrow lines indicates the correlation. The smaller the angle was, the stronger the correlation. CK, KC, DY, JDF, and FH groups indicate control, B. subtilis, B. licheniformis, B. amyloliquefaciens, and combined strains treatments, respectively.
