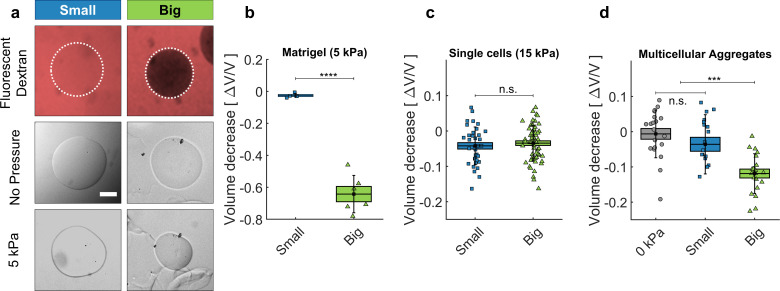
Figure 2. Cell and matrigel compression.
(a) Fluorescently labeled dextran molecules only permeate the beads (top-left panel) if their gyration radius is smaller than 5 nm. Otherwise (top-right panel) they are larger than the exclusion size of the matrigel network and are excluded from the bead. Compression of MG beads, occasioned by dextran molecules of two different sizes (Small: 70 kDa; Big: 500 kDa). Phase contrast images taken before and after the addition of pressure. (b) Beads lose 63 ± 5% of their initial volume when compressed using big dextran, and 2.5 ± 0.7% with small Dextran. N = 10. (c) Compression of individual cells using dextran of different sizes, with 15 kPa. At 5 kPa the compressibility of individual cells is not measurable. Cell compressibility is thus negligible in comparison to that of Matrigel. (d) MCS compression under 5 kPa, exerted using small (blue) and big (green) dextran molecules. In control experiments (0 kPa), the culture medium is replaced by fresh medium without dextran. (box : ±SEOM; error bars: ± SD • : single realizations).

