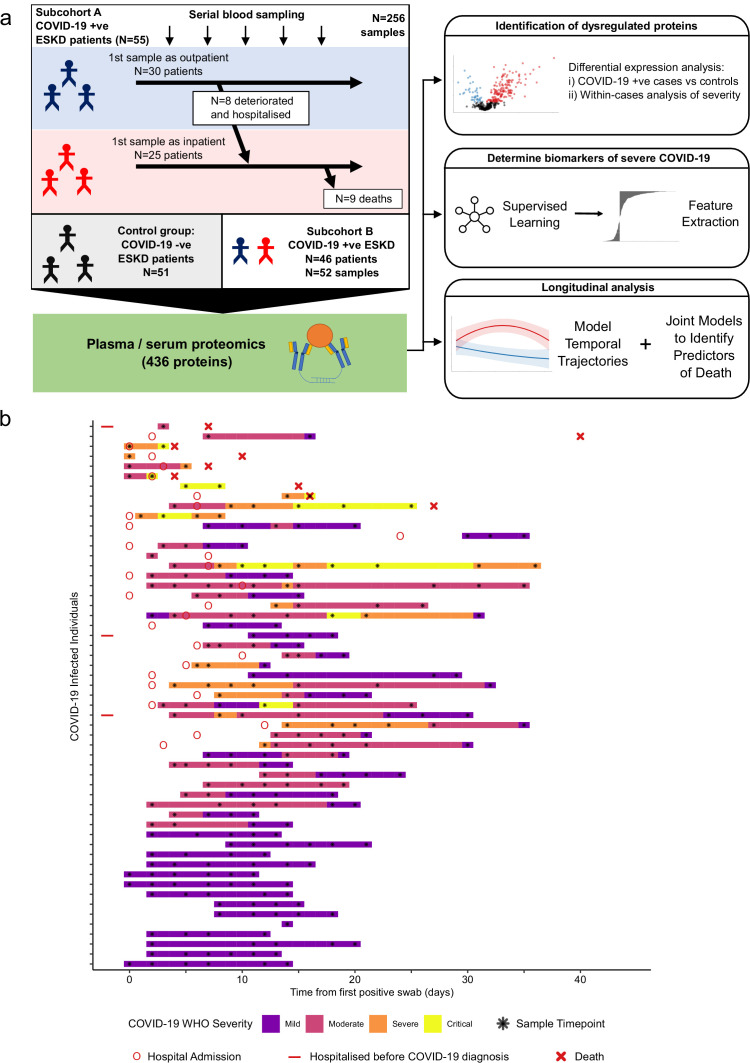
Figure 1. Study design.
(a) Schematic representing a summary of the patient cohorts, sampling, and the major analyses. Blue and red stick figures represent outpatients and hospitalised patients, respectively. (b) Timing of serial blood sampling in relation to clinical course of COVID-19 (subcohort A). Black asterisks indicate when samples were obtained. Three patients were already in hospital prior to COVID-19 diagnosis (indicated by red bars).


