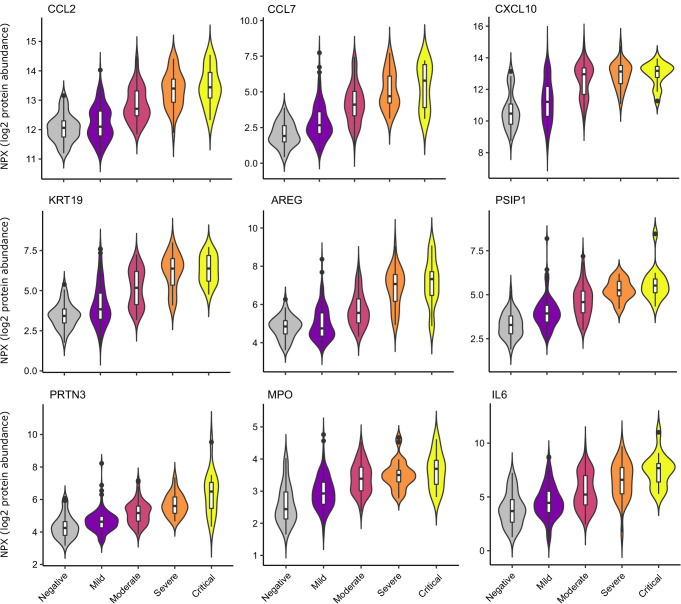
Figure 5. Selected proteins strongly associated with COVID-19 severity.
Violin plots showing distribution of plasma protein levels according to COVID-19 status at the time of blood draw. Boxplots indicate median and inter-quartile range. n = 256 samples from 55 COVID-19 patients and 51 samples from non-infected patients. WHO severity indicates the clinical severity score of the patient at the time the sample was taken. Mild n = 135 samples; moderate n = 77 samples; severe n = 29 samples; critical n = 15 samples. Upper: monocyte chemokines. Middle: markers of epithelial injury. Lower: two neutrophil proteases and IL6.

