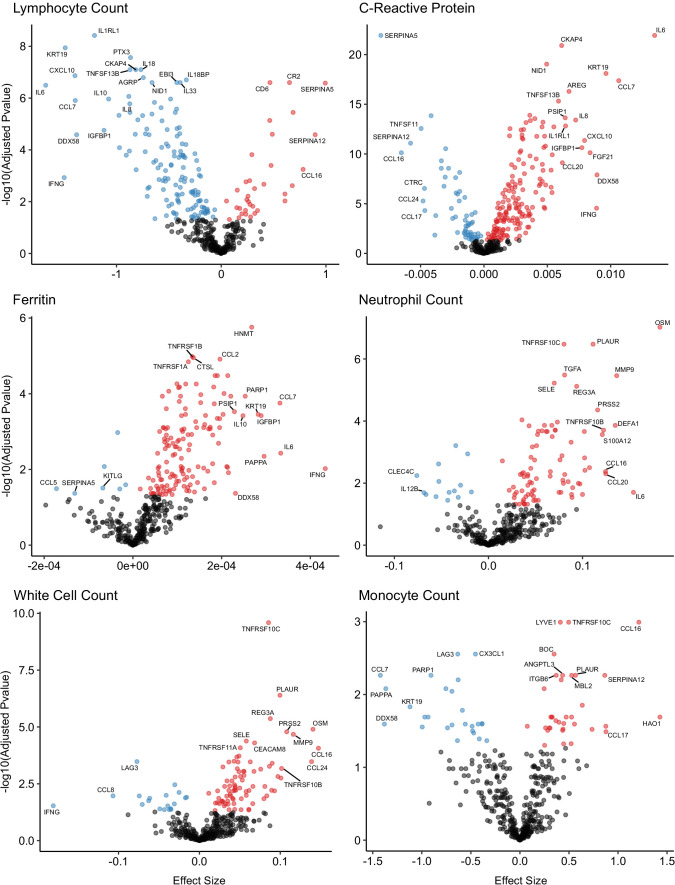
Figure 8. Associations of clinical laboratory markers with plasma proteins.
Proteins that are positively (red) or negatively (blue) associated with clinical laboratory parameters (5% FDR). p-values from differential abundance analysis using linear mixed models after Benjamini–Hochberg adjustment. Dark-grey = non-significant. Two associations were found for d-dimer (not shown – see Supplementary file 1g).

